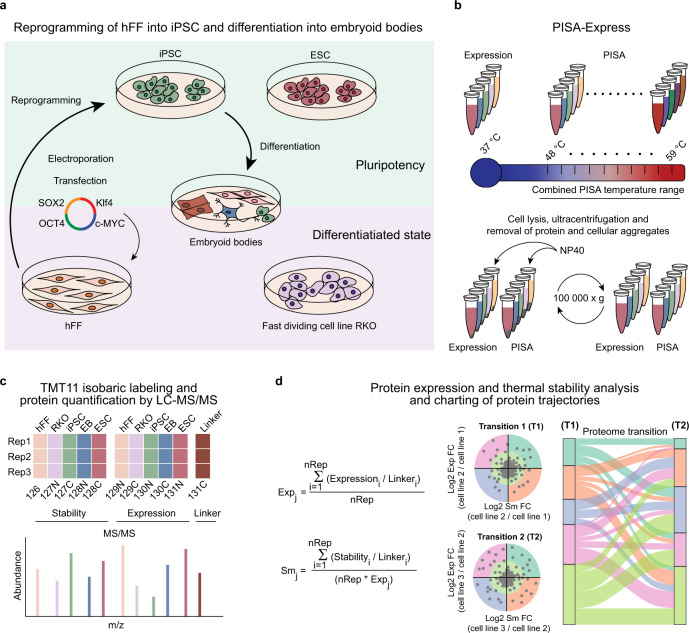
Fig. 1. Protein thermal stability and expression changes in cell-type transitions.
a Cells of different types in were grown simultaneously (n = 3 biologically independent samples per cell type). b Cells were collected and heated in a narrow temperature range, with one sample incubated at 37 °C for expression measurements, protein aggregates were eliminated by ultracentrifugation and the soluble proteins were digested. c 1/10 portions of each sample were integrated into a pooled sample and digests were labelled by TMT11 and multiplexed. d The same pooled sample was used in all multiplexed sets for normalization or reporter ion abundances PISA parameter (Sm) and expression fold change (Exp) were calculated, and protein trajectories during cell transitions were charted using a Sankey diagram.

