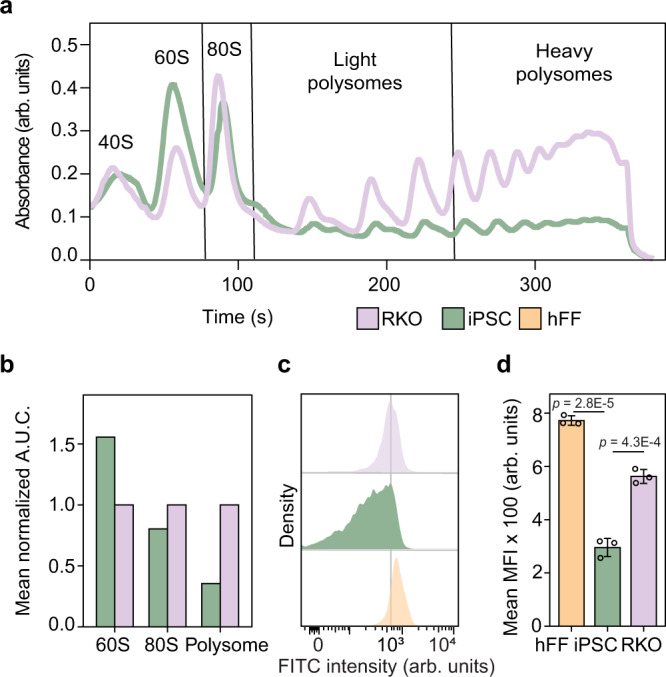
Fig. 4. iPSCs have lower polysome content and protein synthesis rate than differentiated cells.

a Ribosome density profile on a 10–50% sucrose gradient of hi12 iPSC lysates against that of RKO cells. b Analysis of the area under the curve (A.U.C.) of several fractions of the ribosome profile (n = 2 biologically independent samples). c Measurement of OPPuro incorporation in hi12 iPSC, hFF, and RKO. The gating strategy is described in Supplementary Fig. 6k. d Analysis of mean fluorescence intensity (MFI) from OPPuro incorporation in hi12 cells, hFFs and RKO cells (n = 3 biologically independent samples for each cell line). P-values were calculated using a two-sided Student t-test. p < 0.05 were considered as significant. Error bars represent ±the standard deviation of the mean. Source data are provided as a Source Data file.
