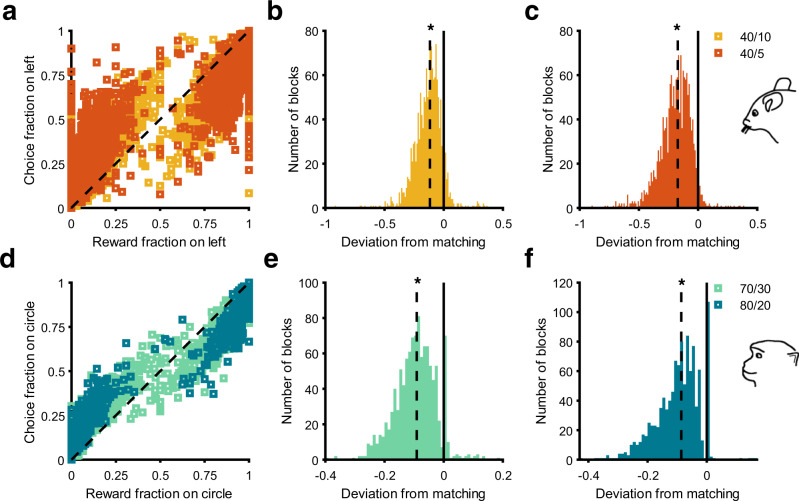
Fig. 2. Mice and monkeys exhibit highly variable but significant undermatching.
a Plot shows relative reward fraction versus relative choice fraction across all blocks separately for each reward schedule in mice. The black dashed line represents the identity line. For relative reward fractions >0.5, nearly all points remain below the identity line, indicating a relative choice fraction smaller than reward fraction for the better option (undermatching). Similarly, points above the identity line for relative reward fractions <0.5 indicate undermatching. b, c Histograms show deviation from matching for the 40/10 (b) and 40/5 reward schedules (c) in mice. The solid black line indicates 0, corresponding to perfect matching. The dashed black lines are the median deviation from matching. Asterisks indicate significance based on a two-sided Wilcoxon signed-rank test . d–f Similar to (a–c), but for monkeys with 70/30 and 80/20 reward schedules. Asterisks indicate significance based on a two-sided Wilcoxon signed-rank test . Because of random fluctuations in local reward probabilities, overmatching occurred in a minority of cases.

