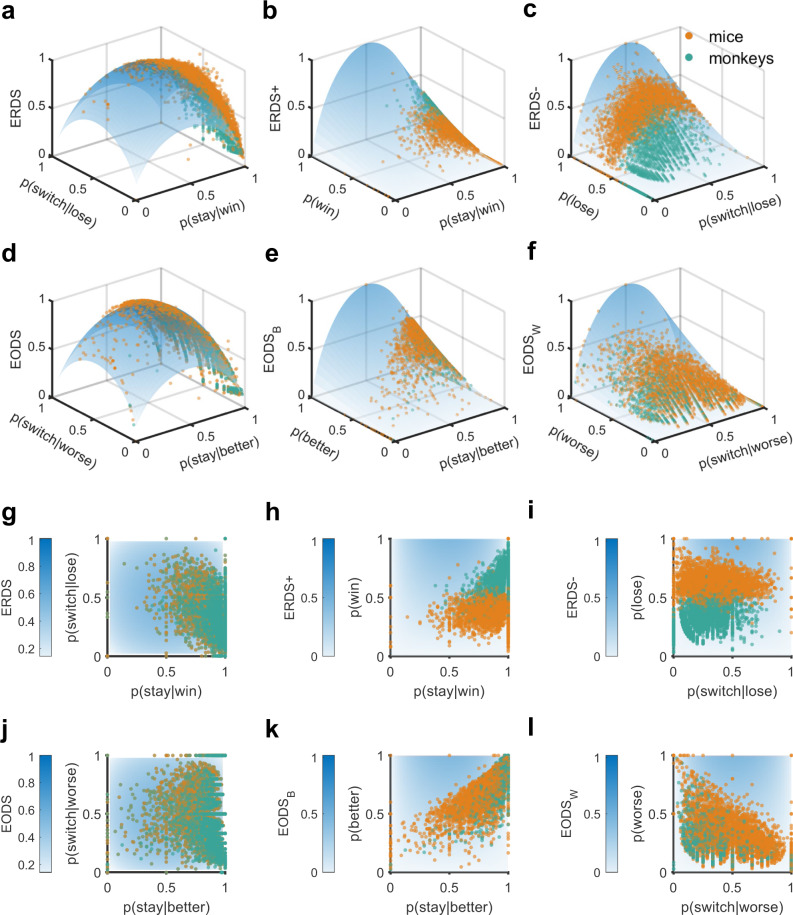
Fig. 3. Relationship between entropy-based metrics and win-stay, lose-switch strategies.
a–c Plotted are ERDS and ERDS decompositions for rewarded and unrewarded trials (ERDS+ and ERDS−) as a function of p(win), p(lose), win-stay, and lose-switch. Darker colors correspond to larger values of metrics. For the plot in (a), p(win) is set to 0.5. Observed entropy-based metrics and constituent probabilities for each block for mice (orange dots) and monkeys (green dots) are superimposed on surfaces. d–f EODS and EODS decompositions for the better and worse options (EODSB and EODSW) as a function of the probabilities of choosing the better and worse options, p(better) and p(worse), conditional probability of stay on the better option, and conditional probability of switch from the worse option. For the plot in (d), p(better) is set to 0.5. For all plots, the units of entropy-based metrics are bits. g–i Same as in (a–c) but using heatmap. j–l Same as in (d–f) but using heatmap.

