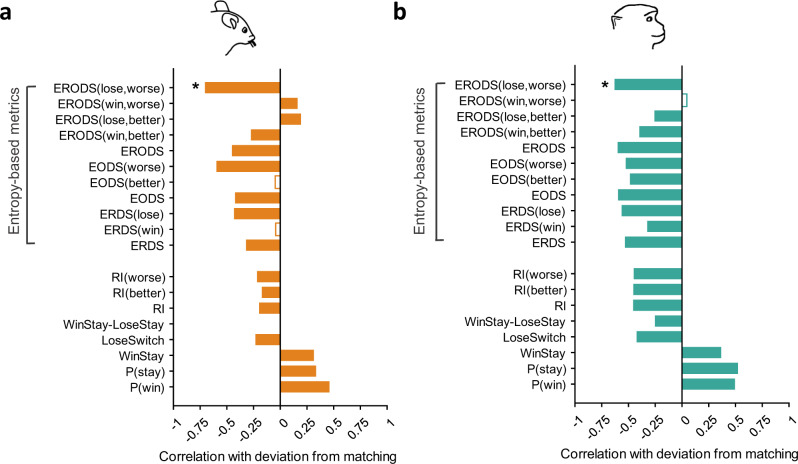
Fig. 4. Correlation between undermatching and proposed entropy-based metrics and underlying probabilities.
a Pearson correlation between proposed entropy-based metrics and existing behavioral metrics and deviation from matching in mice. Correlation coefficients are computed across all blocks, and metrics with nonsignificant correlations (two-sided, to account for multiple comparisons) are indicated with a hollow bar. The metric with the highest correlation with deviation from matching is indicated with a star (ERODSW−; ). b Similar to (a) but for monkeys (ERODSW−; ). Overall, entropy-based metrics show stronger correlation with deviation from matching than existing metrics.

