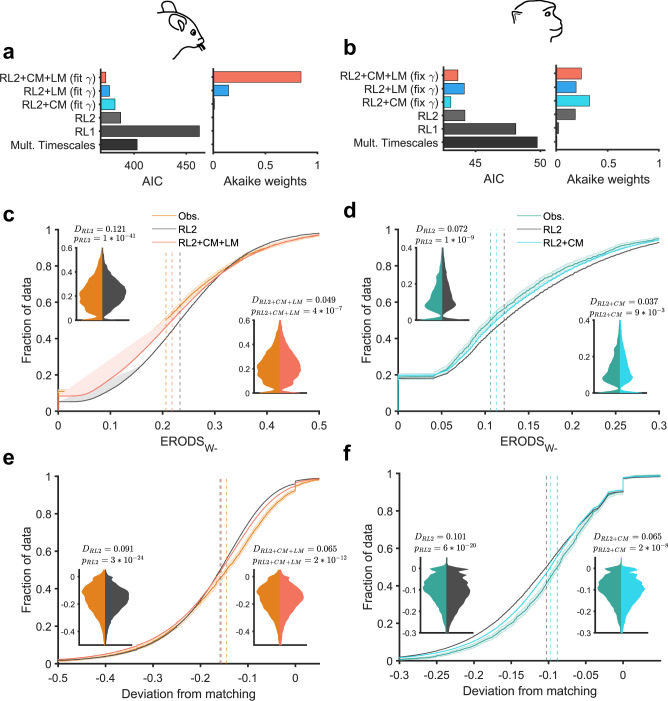
Fig. 5. RL2 + CM + LM and RL2 + CM models better account for choice behavior, undermatching, and entropy-based metrics in mice and monkeys, respectively.
a, b Comparison of goodness-of-fit of a return-based (RL1) model, income-based (RL2) model, income-based models augmented with choice memory (CM) and/or loss-memory (LM) components, and a model based on learning on multiple timescales. Plotted is the Akaike Information Criterion (AIC) averaged over all sessions and Akaike weights computed with the average AIC for mice (a) and monkeys (b). c–f Empirical cumulative distribution functions of ERODSW− (c, d) and deviation from matching (e, f) observed in animals and predicted from simulations of the RL2 and RL2 + CM + LM models. Shaded bars around CDFs indicate 95% confidence interval. Dashed vertical lines indicate the median of each distribution. Insets display the distribution of observed metrics versus metrics predicted using the RL2 model (left inset) and RL2 + CM + LM model and RL2 + CM model (right inset) for mice and monkeys, respectively. Displayed D-values and p values are the test-statistic and p value from a two-sided Kolmogorov–Smirnov test comparing the distributions. The RL2 + CM + LM model and RL2 + CM better captured deviation from matching by over 20% and over 30% in mice and monkeys, respectively.

