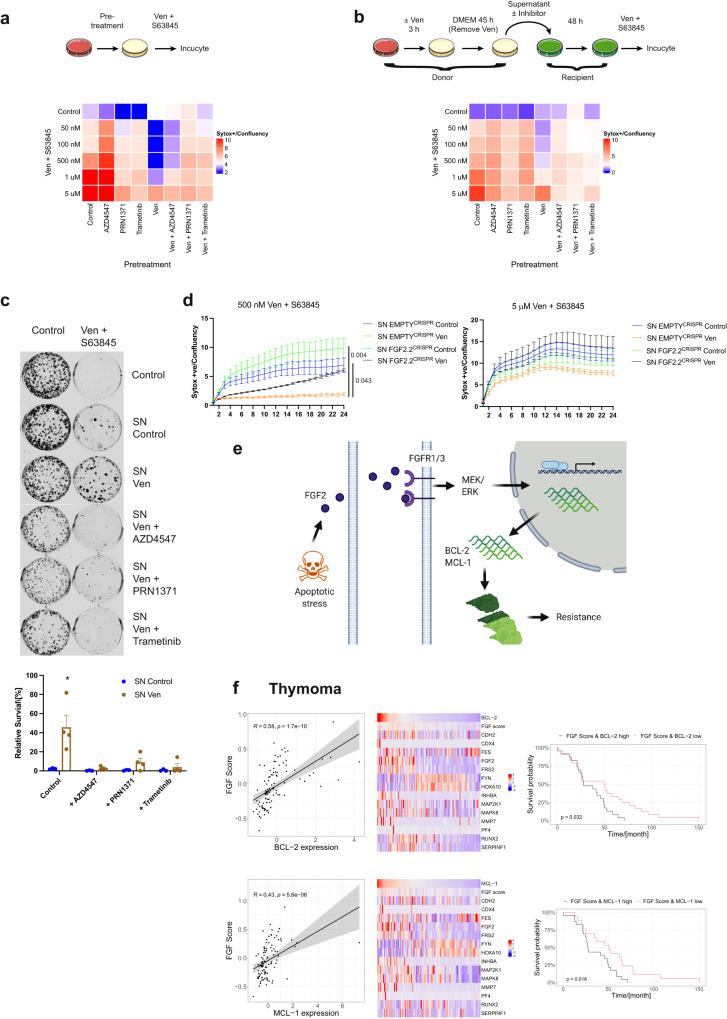
Fig. 6. FGF signalling is essential for non-cell autonomous apoptotic resistance.
a HeLa tBID2A cells were treated with 500 nM venetoclax in combination with RTK pathway inhibitors (AZD4547 (5 μM), PRN1371 (10 μM) or trametinib (500 nM)) as indicated for 48 h. Then the cells were treated with the indicated concentrations venetoclax + S63845 and cell survival was monitored by Incucyte. Heatmap colours show cell death at 24 h (mean from n = 3 independent experiments), corresponding survival curves are shown in Supplementary Fig. 5a. b HeLa tBID2A cells were incubated with 500 nM venetoclax treated supernatant supplemented with RTK pathway inhibitors (AZD4547 (5 μM), PRN1371 (10 μM) or trametinib (500 nM)) as indicated before addition onto recipient cells for 48 h. Then the cells were treated with the indicated concentrations venetoclax + S63845 and cell survival was monitored by Incucyte. Heatmap colours show cell death at 24 h (mean from n = 3 independent experiments), corresponding survival curves are shown in Supplementary Fig. 5b. c HeLa tBID2A cells were plated at low density (1000 cells per 6 well) and incubated with 500 nM venetoclax-treated supernatant supplemented with RTK pathway inhibitors (AZD4547 (5 μM), PRN1371 (10 μM) or trametinib (500 nM)) as indicated for 48 h. Cells were then treated with 2.5 μM venetoclax + S63845 for another 48 h before replacement with regular growth medium. After an additional 5 days colonies were visualised by crystal violet staining and quantified. n ≥ 3 independent experiments; mean values ± s.e.m.; *p < 0.05 compared to all other treatments; Tukey corrected one-way ANOVA. d Control or FGF2 deficient cells were treated for 3 h with 500 nM venetoclax followed by 45 h regular medium. Then the supernatant was harvested and added to control cells for 48 h. After that, the cells were treated with venetoclax + S63845 with the indicated doses and survival monitored by Incucyte. n = 3 independent experiments; mean values ± s.e.m.; *p < 0.05 compared to venetoclax treatment at 24 h; Tukey corrected one-way ANOVA. e Working model. f Pearson correlation between FGF Score and BCL-2 (upper left) or MCL-1 (lower left) in the TCGA Thymoma dataset (± s.e.m, 105 patients). FGF score, FGF receptor target gene and BCL-2 (upper middle) or MCL-1 (lower middle) expression in the TCGA Thymoma dataset. Survival of TCGA Thymoma patients stratified by FGF score and BCL-2 (upper right) or MCL-1 (lower right) expression (p value was calculated with a log-rank test).

