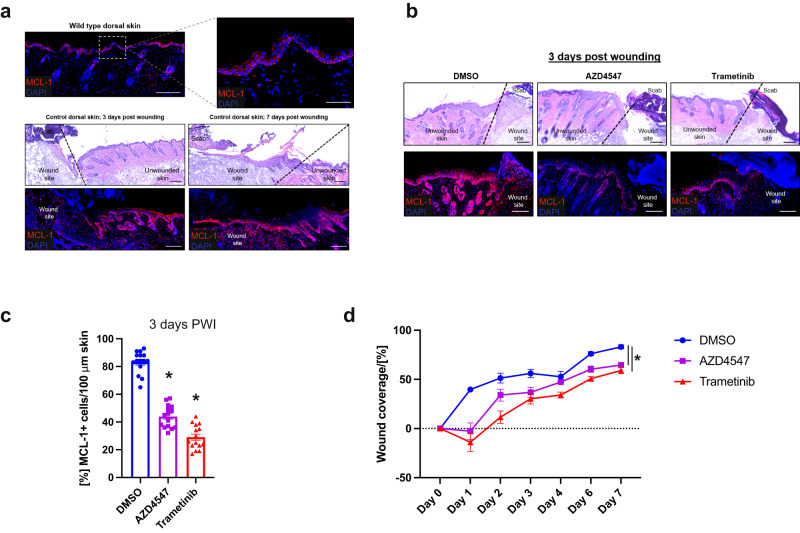
Fig. 7. FGFR and MEK inhibition decreases MCL-1 expression and hinders wound repair.
a H & E and immunostaining of MCL-1 in unwounded skins and 3 or 7 days post wounding (PWI). Representative image of n = 15 mice, Scale bar: 200 µm, Inset 50 µm. The wound edge is indicated with a black broken line. b H & E and immunostaining of MCL-1 in skins 3 days post wounding in DMSO or inhibitor treated mice as indicated. Representative image of n = 15 mice per group, Scale bar: 200 µm. The wound edge is indicated with a black broken line. c Quantification of MCL-1 positive cells in the area surrounding the wound site. n = 15 mice per group, each dot represents an individual mouse, mean values ± s.e.m.; *p < 0.0001 compared to DMSO; Tukey corrected one-way ANOVA. d Quantification of dorsal wound coverage in DMSO or inhibitor treated mice over a 7-day period. N ≥ 2 mice per group, each dot represents an individual mouse, mean values ± s.e.m.; Tukey corrected one-way ANOVA at day 7.

