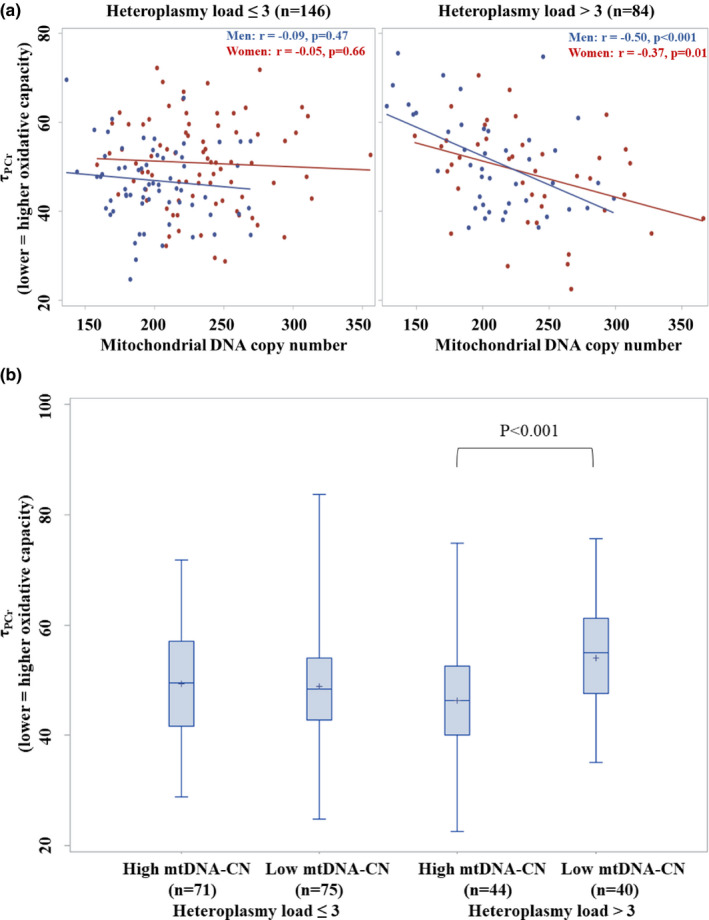
FIGURE 1.

Scatter plots (A) (red: women; blue: men) and boxplots (B) for the unadjusted relationship between mitochondrial DNA copy number and τPCr in participants with low and high heteroplasmy load. Caption: τPCr, the PCr exponential recovery time constant measured in seconds, higher values of which indicate longer recovery time and lower oxidative capacity. In scatter plots, the specific amount of mitochondrial DNA copy number attributed to low and high heteroplasmy load ranged from 136 to 356, and from 127 to 366, respectively. In boxplots, mitochondrial DNA copy number was categorized by a median split at 216
