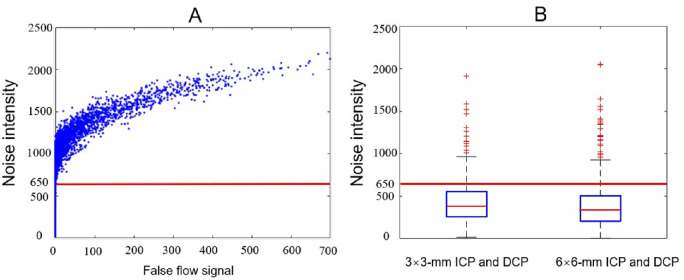
Figure 5.
False flow signal and noise intensity. (A) The relationship between false flow signal and noise intensity. The blue points indicate six thousand 3-mm × 3-mm ICP and DCP angiograms with different simulated noise intensities. The red line represents a cutoff value (INoise = 650) under which no false flow signal was generated. (B) Boxplots of the noise intensity measured in original 3-mm × 3-mm and 6-mm × 6-mm ICP and DCP angiograms from all data sets. The average noise intensities of original 3-mm × 3-mm and 6-mm × 6-mm angiograms are below 650.

