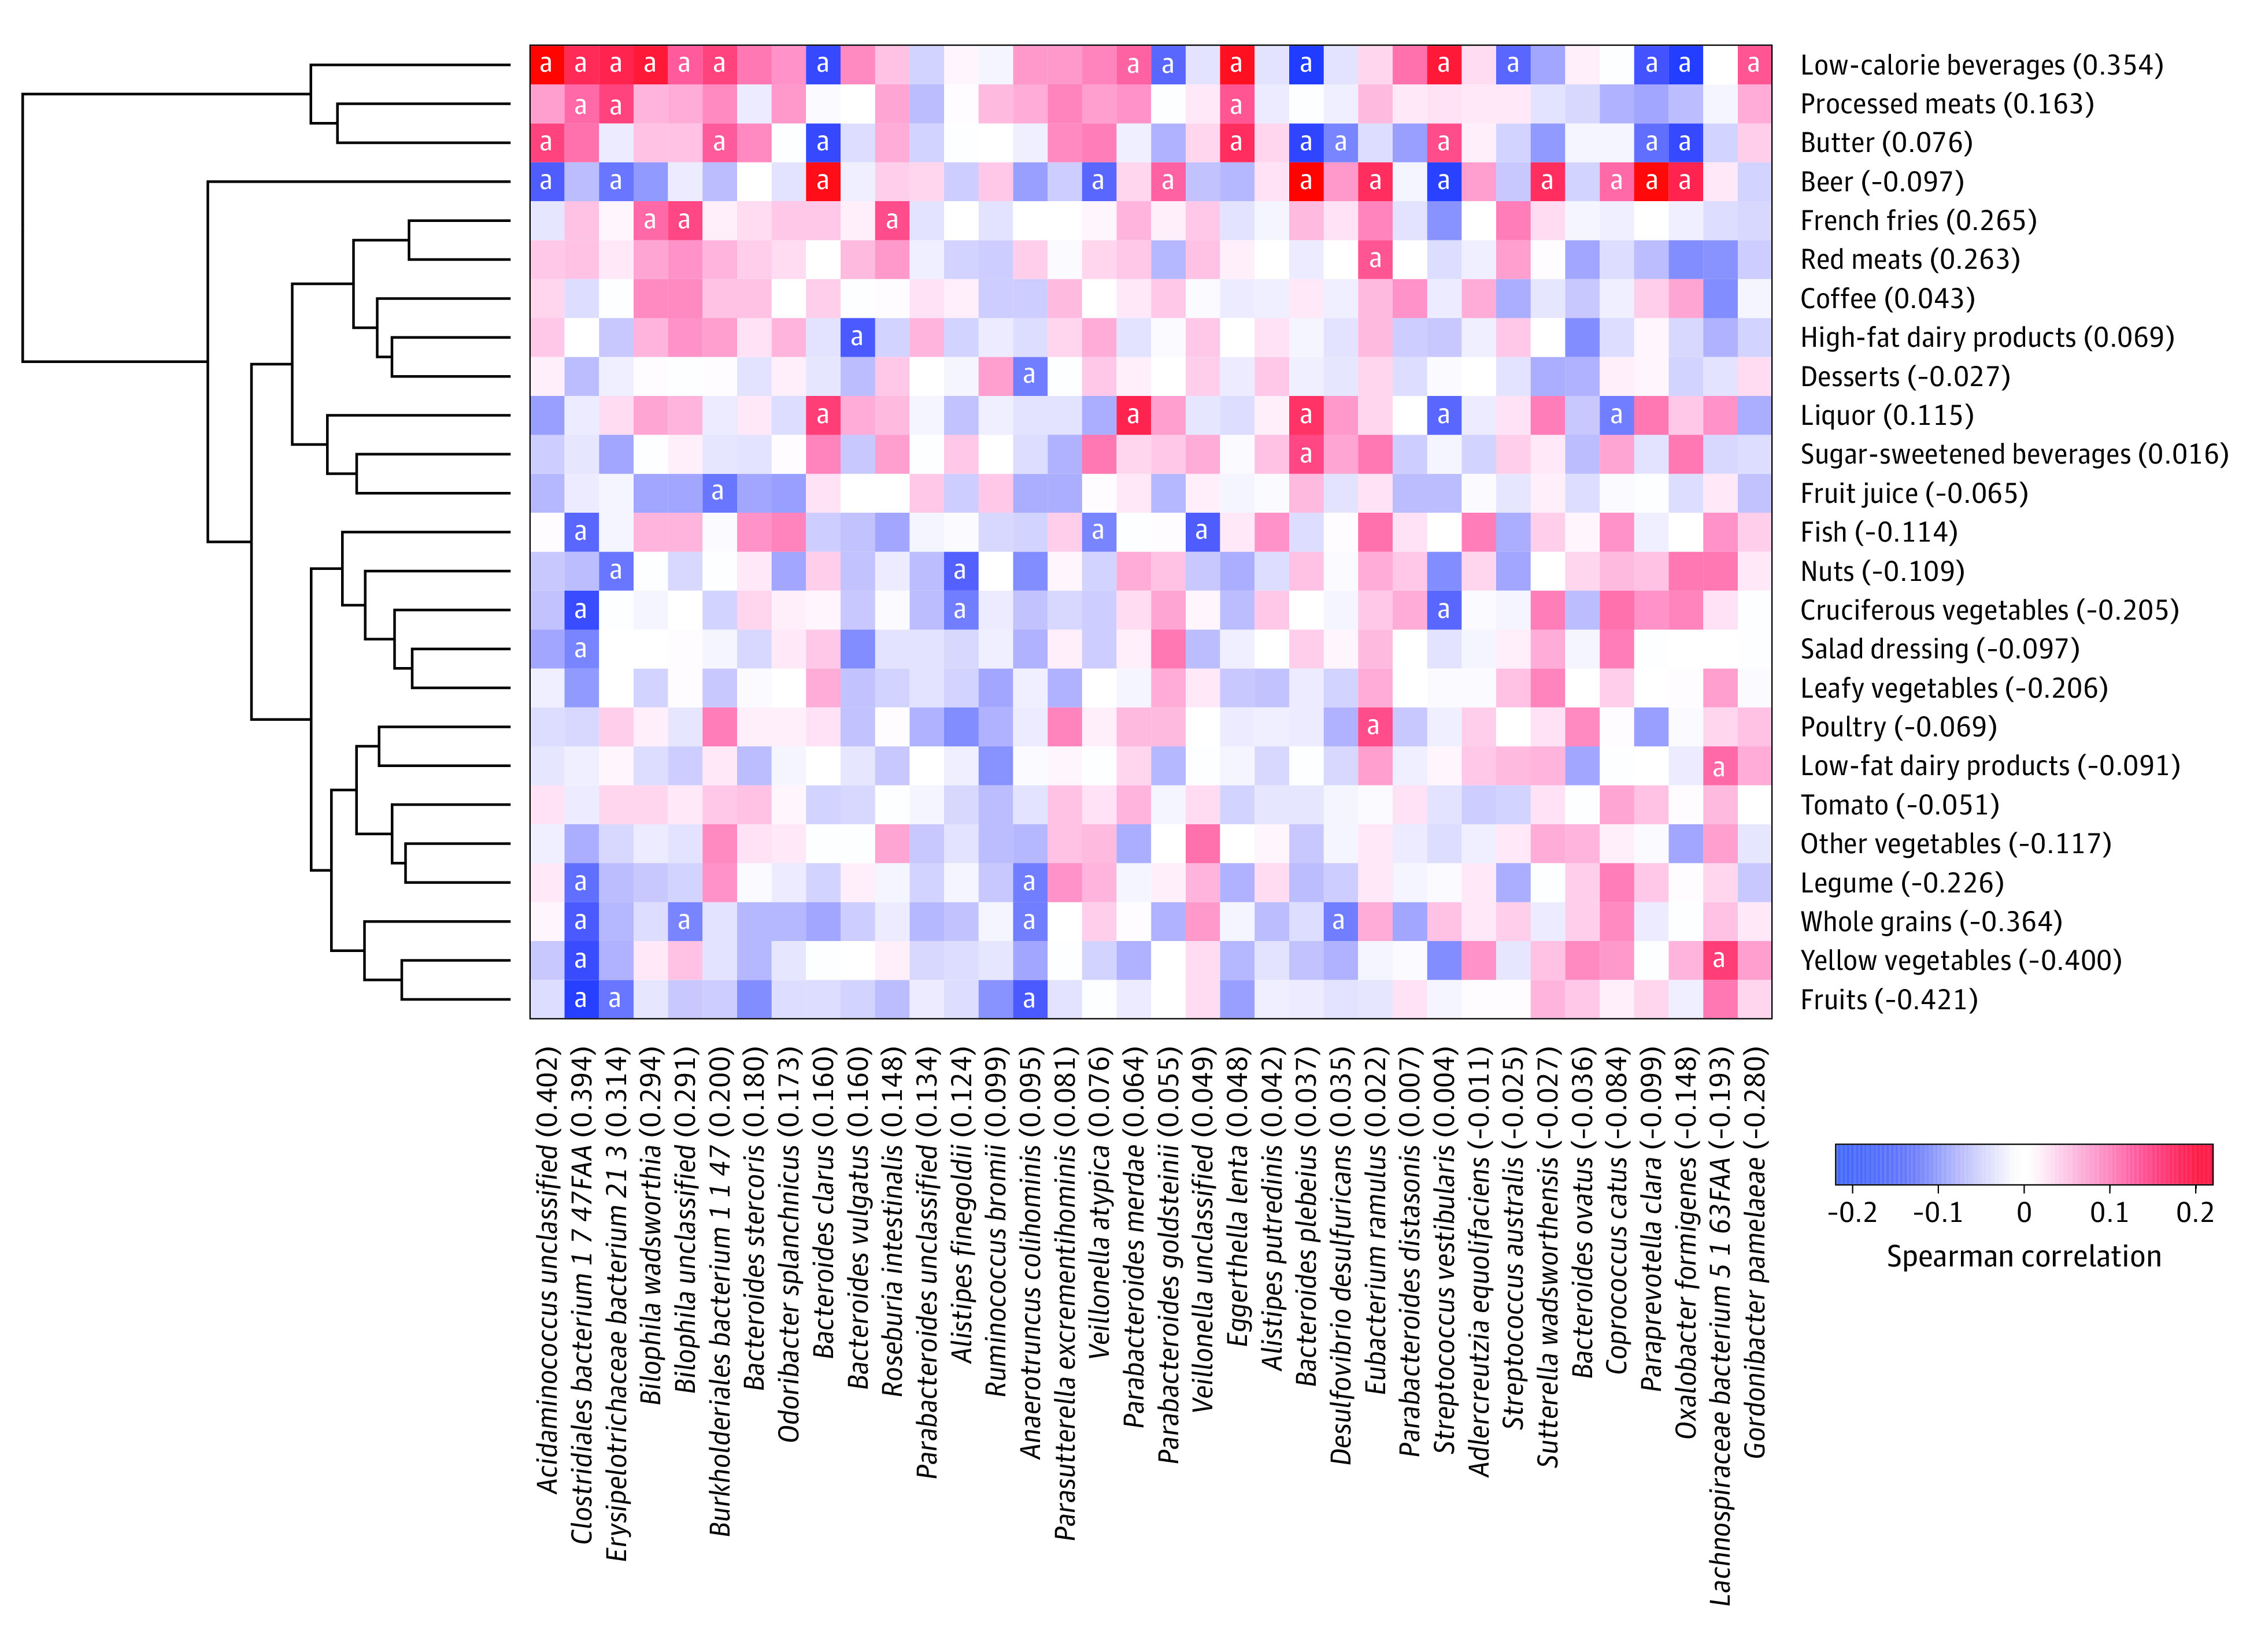
Figure 1. Sparse Canonical Correlation Analysis of Dietary Intake and Sulfur-Metabolizing Bacteria.

Pairwise Spearman correlations between selected food groups and bacteria. Numbers in parentheses are the weights for food groups and bacteria, whose linear combination maximizes the correlation (0.375). The food group weights were used to create the sulfur microbial diet score.
aStatistically significant correlations (Benjamini-Hochberg false discovery rate <0.25).
