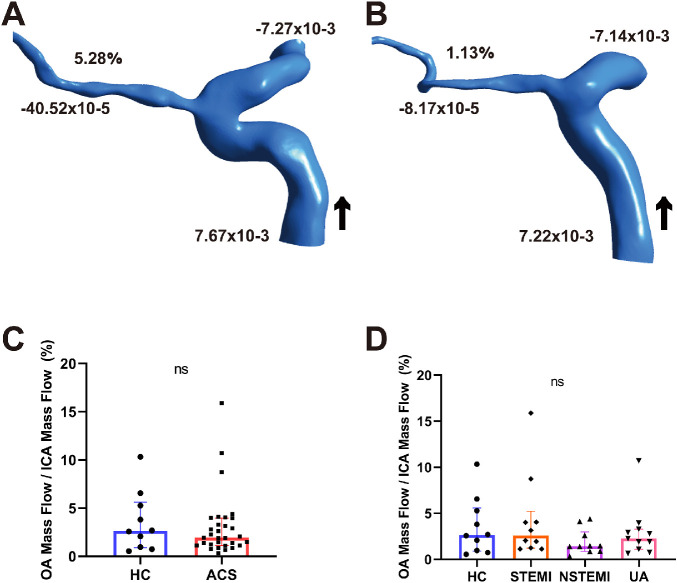
Figure 3.
Mass flow (kg/s) and mass flow ratio of the OA to ipsilateral ICA (%) of two representative models from HCs (A) and a patient with ACS (B). (C, D) Comparisons of the mass flow ratio of OA to ipsilateral ICA (%) between ACS and HC. Black arrow indicates blood flow direction. ns, not significant; +, inlet; –, outlet.

