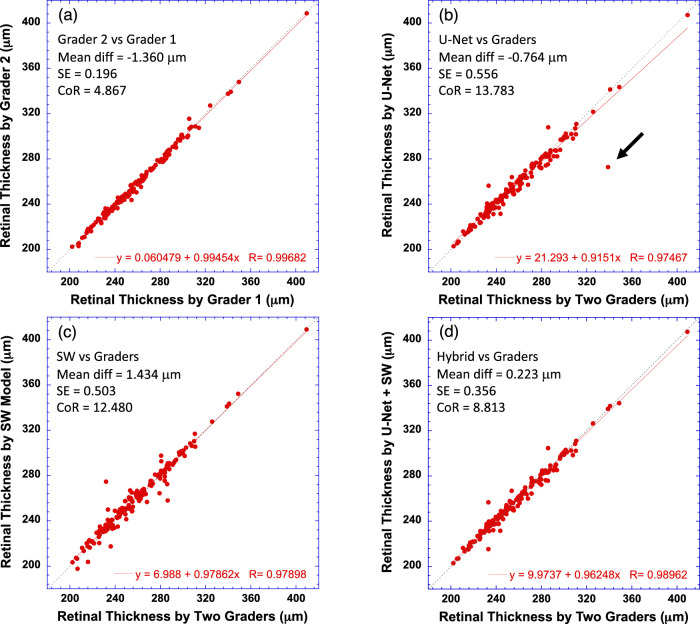
Figure 10.
Comparison of the average retinal (ILM-BM) thickness across the B-scan width measured by the CNN models to human graders. (a) Comparison of two human graders. (b) Retinal thickness measured by the U-Net model versus the average of two human graders. (c) Retinal thickness measured by the SW model versus the human graders. (d) Retinal thickness measured by the hybrid model versus the human graders. The equation in each plot is the linear fitting result (red solid line) to the data. Dotted line has a slope of 1. Bland–Altman analysis results are also shown in text in each plot.

