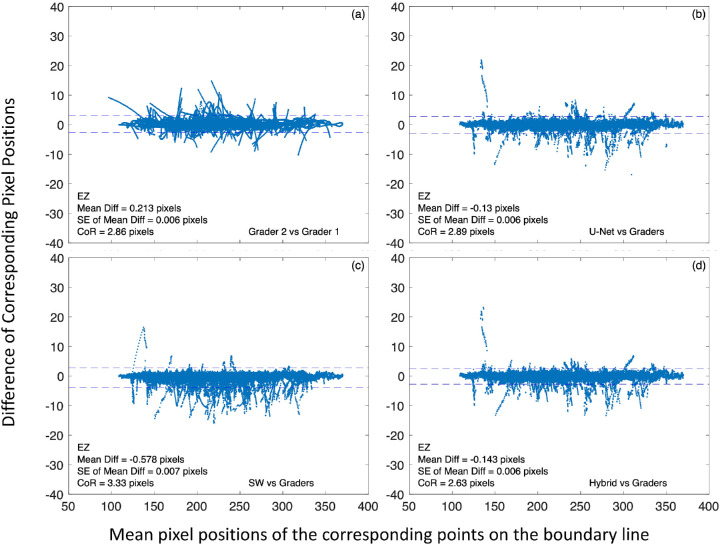
Figure 6.
Examples of Bland–Altman plots of central 6-mm EZ line segmentation by the CNN models to human graders for all 160 test B-scans. In each plot, the horizontal axis is the mean pixel position of the corresponding points on the boundary lines obtained by different segmentation methods. This position is referenced to the top of a B-scan image (i.e., it is an A-scan pixel position). The vertical axis is the difference of corresponding pixel positions. (a) Comparison of two human graders. (b) U-Net segmentation versus the average of two human graders. (c) The SW model segmentation versus human graders. (d) The hybrid model segmentation versus human graders. CoR is defined as 1.96 times the standard deviation of the difference. Dashed horizontal lines represent ±95% limit of agreement (mean ± CoR).

