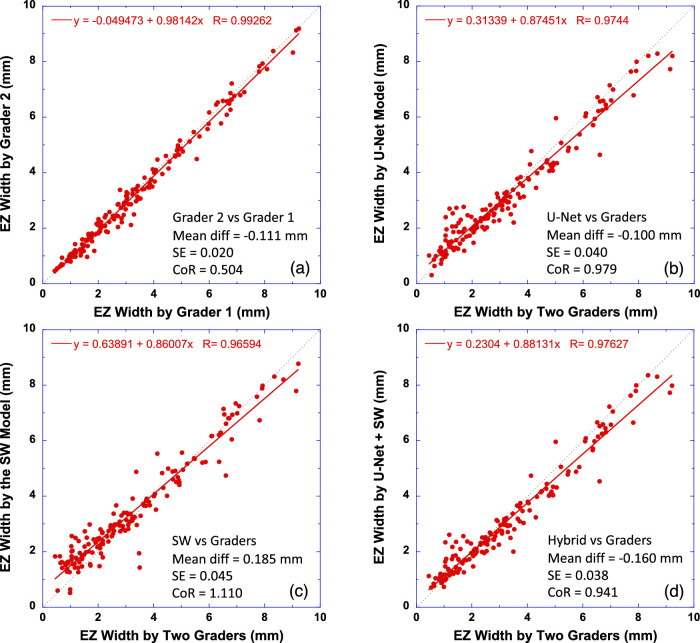
Figure 7.
Comparison of EZ width measurements by the CNN models to human graders. (a) Comparison of two human graders. (b) EZ width measured by the U-Net model versus the average of two human graders. (c) EZ width measured by the SW model versus the human graders. (d) EZ width measured by the hybrid model (U-Net + SW) versus the human graders. The equation in each plot is the linear fitting result (red solid line) to the data. Dotted line has a slope of 1. Bland–Altman analysis results are also shown in text in each plot.

