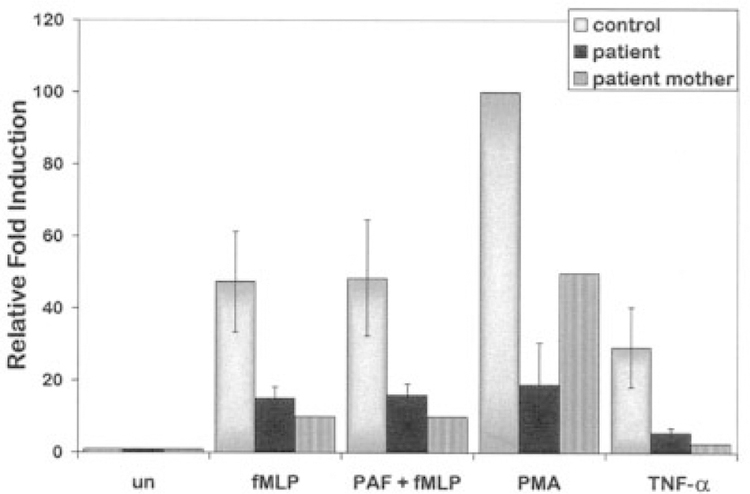
Figure 3.
Flow cytometry analysis of oxidant production in neutrophils. Shown is the relative oxidative burst in neutrophils isolated from the patient and from her mother and in control neutrophils treated with fMLP, platelet-activating factor (PAF) plus fMLP, phorbol myristate acetate (PMA), or tumor necrosis factor α (TNFα). Data are the results from 3 experiments with the patient’s neutrophils and 1 experiment with neutrophils isolated from the patient’s mother. Values are the mean ± SEM of 3 experiments for the patient. Neutrophils from both the patient and her mother showed reduced oxidative burst compared with control neutrophils (P < 0.05 by analysis of variance). un = unstimulated neutrophils.

