
Figure 6. Characterization of the cumulative effects of successive CSDs.
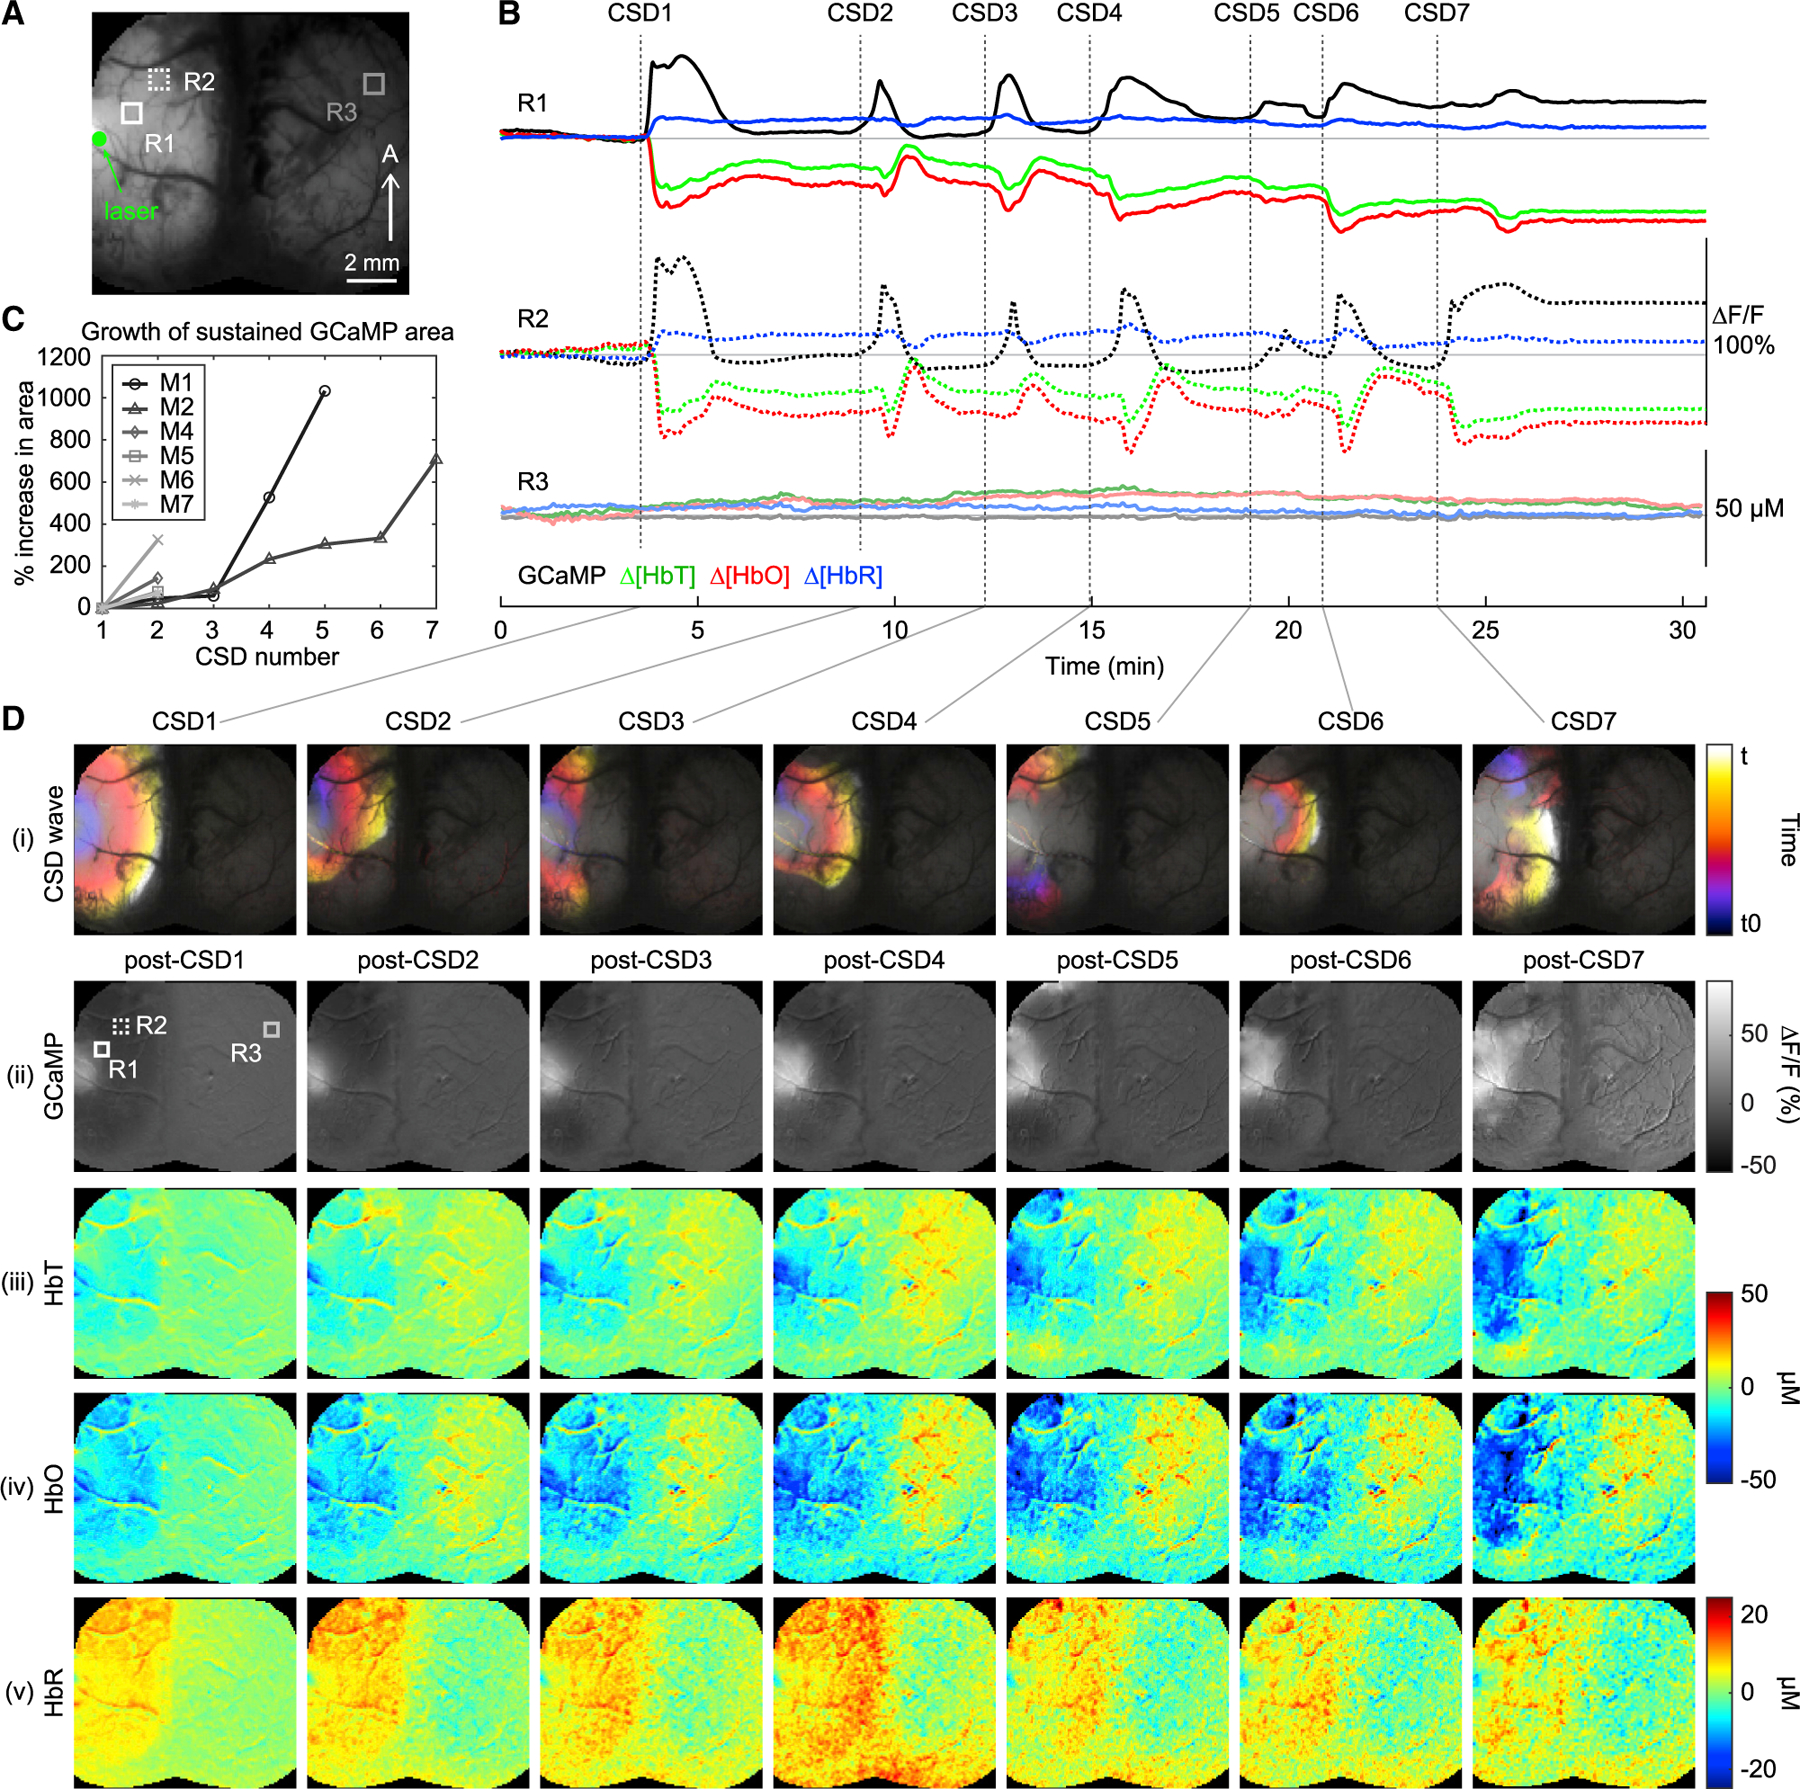
(A) Grayscale cortical image shows the ROIs used for the time courses in (B) and their relative locations to the laser focus.
(B) GCaMP ∆F/F, [HbT], [HbO], and [HbR] traces extracted from two ipsilateral regions, R1 and 2, and one contralateral region, R3, indicated by boxed ROIs in the raw cortical image in (A).
(C) Plot shows percentage increase in area of the region with sustained GCaMP fluorescence (relative to post-CSD1) following successive CSDs in each mouse. See STAR Methods for details on how percentage growth was calculated.
(D) (i) Cortical maps color-coded by time, showing the propagation dynamics of each CSD for an animal that experienced 7 CSDs (denoted as CSD1-CSD7, see STAR METHODS). See also Video S3 for full movies of these events. (ii-v) Cortical maps showing post-CSD levels of GCaMP ∆F/F, [HbT], [HbO], and [HbR] respectively 5 s after the completion of each CSD event. The spatial maps highlight the growing areas of elevated GCaMP fluorescence and accompanying hypoperfusion after each successive CSD.