Figure 2.
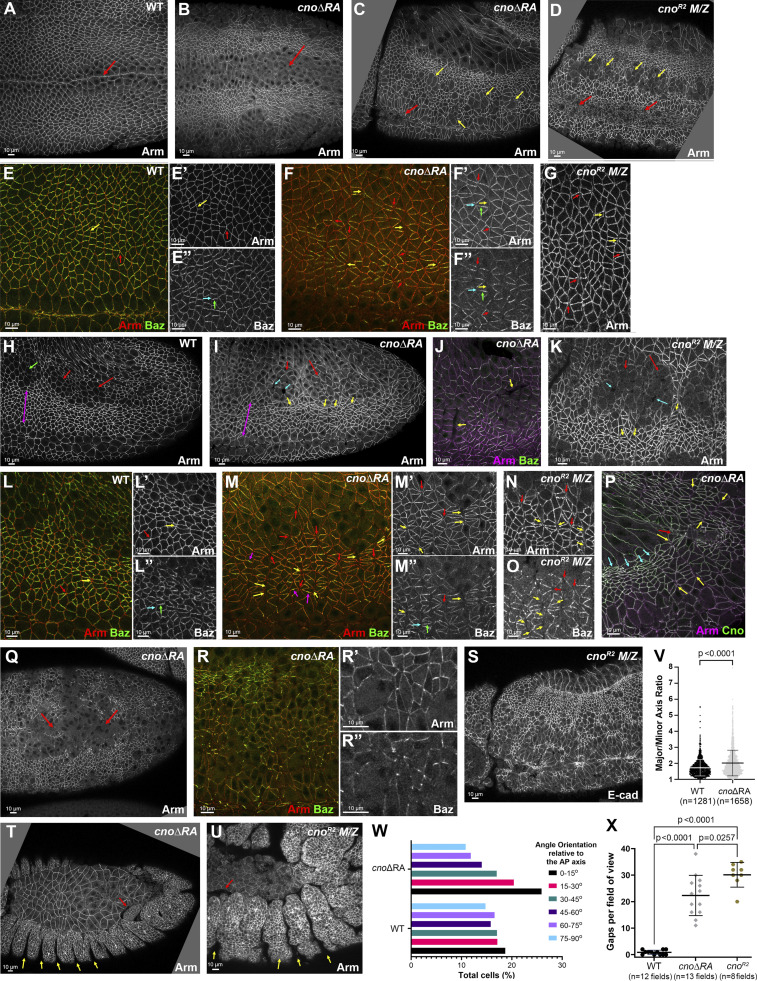
Deleting the RA domains substantially reduces Cno function in morphogenesis. Embryos, genotype, and antigens are indicated. In all figures, embryos are anterior left and, unless noted, dorsal up. (A and B) Stage 8 ventral view. Mesoderm invagination is delayed in cnoΔRA (A vs. B, arrows). (C and D) Stage 9. cnoΔRA ventral open phenotype (C, red arrow) is similar to but less severe than cno M/Z null mutants (D, red arrows). In both, more cells remain rounded up after division (yellow arrows). (E–G) Stage 7. (E) WT. Arm is continuous around cells (yellow arrow) and extends to TCJs (red arrow). (F) cnoΔRA. Gaps at AP borders (yellow arrows) and TCJs (red arrows). Accentuated Baz planar polarity (E″ vs. F″, cyan versus green arrows). (G) Similar gaps in cno M/Z null mutants. (H–O) Stage 8. (H) WT. (I and J) cnoΔRA. Neurectoderm (magenta double-headed arrow). Note stacks of elongated cells (I and J, yellow arrows) and gaps (cyan arrows) between mitotic cells (red arrows). Cells folded inward (J, arrows). (K) Similar defects in cno M/Z null mutants. (L–O) Closeups, stage 8. (L) WT. Arm is continuous at shrinking AP borders (yellow arrow) and TCJs (red arrow). (M) cnoΔRA. Large gaps along many AP borders (yellow arrows) or at TCJs (red arrows). Baz is hyperplanar polarized (L″ vs. M″). (N–O) cno M/Z null mutants have similar defects. (P) Stage 9. cnoΔRA. Cells remain elongated and aligned in stacks (cyan arrows). Gaps remain (yellow arrows), especially where tissue is most curved (red arrow). (Q–R) Stage 10. (Q) Epithelial integrity disruption at the ventral midline. (R) Baz lost from AJs more rapidly than Arm. (S) cno M/Z null mutants have similar defects. (T and U) Stage 13. (T) cnoΔRA. (U) cno M/Z null mutants. Segmental grooves remain (yellow arrows). Epidermis separates from amnioserosa (red arrows). (V) Analysis of cell shape. Unpaired t test with Welch’s correction (two-tailed P value) statistical analysis, and n indicates the number of cells. Graph indicates mean ± SD. (W) Distribution of cell orientations relative to the AP axis. (X) Quantification of gaps. Brown Forsythe and Welch ANOVA statistical test, and n indicates fields of view. Graph indicates mean ± SD.

