Figure 4.
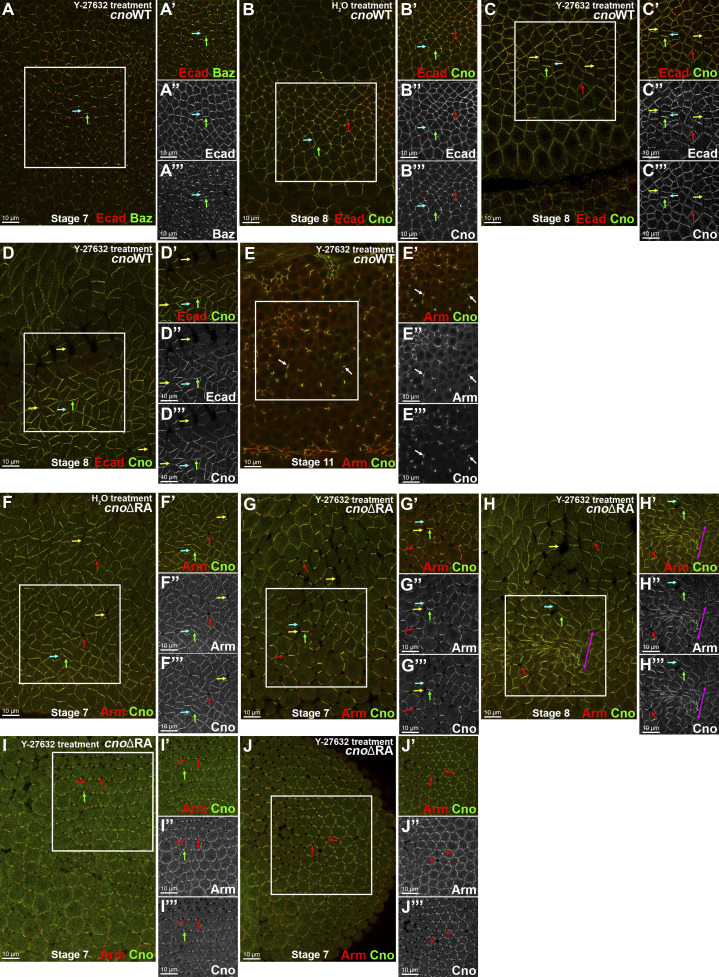
Disrupting tension affects Baz, Cno, and AJ proteins planar polarity and tissue integrity. (A–E) cnoWT-GFP embryos. (F–J) cnoΔRA M/Z embryos. Treatment as indicated. (A) Stage 7. ROCK inhibition leads to Baz (A″’) and Ecad (A″) accentuated planar polarity to DV borders (green arrows). Baz is lost from many AP borders (A″’, cyan arrows). (B–D) Stage 8. (B) Control. CnoWT-GFP (B″’) is enriched at AP borders (cyan arrows), present at DV borders (green arrows), and enriched at TCJs (red arrows), as is Ecad (B″). (C and D) ROCK inhibition (100 µM) disrupts CnoWT-GFP (stage 8) enrichment to AP borders (B″’ vs. C″’ and D″’, cyan arrows), thus enhancing Cno and Ecad planar polarization to DV borders (B″ vs. C″ and D″’, green arrows). Note gaps along AP borders (yellow arrows). Note loss or reduction of Ecad (D″) at AP borders (cyan arrow). (E) Stage 11. Fragmentation of Arm and Cno (arrows) when cnoWT-GFP embryos are treated with high concentration (5 mM) of Y-27632, potentially inactivating atypical PKC. (F) Stage 7 control. CnoΔRA planar polarizes to DV borders (F″’; green arrow) and has epithelial integrity disruption at TCJs (red arrows) and along AP borders (yellow arrows). (G–J) cnoΔRA ROCK inhibitor treatment. (G and H) Stage 7 (G) and stage 8 (H). ROCK inhibition further disrupts the tissue’s ability to balance tension, enhancing disruption of AP borders (yellow arrows) and TCJs (red arrows), leading to groups of hyperconstricted cells (H, magenta arrow). (I and J) Two different locations of the same embryo (stage 7): lateral view (I) and posterior region (J). TCJ integrity is disrupted, with TCJs apically opened (red arrows) and Arm (I″, J″) and Cno (I″’, J″’) restricted to bicellular junctions (I and J, green arrows)

