Fig. 3.
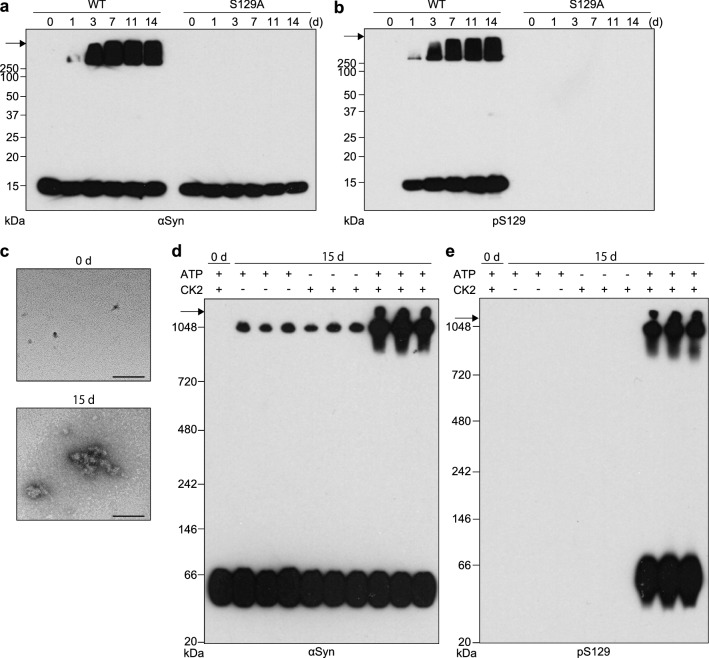
Ser129 phosphorylation by CK2 accelerates αSyn aggregate formation. a, b WT r-αSyn or S129A r-αSyn after 0–14 days of incubation with CK2 and ATP was analyzed by SDS-PAGE followed by immunoblotting with a anti-αSyn antibody D119 and b anti-pS129-αSyn antibody ab51253. c WT r-αSyn after 0 or 15 days of incubation with CK2 and ATP was examined by TEM. Bars, 100 nm. d, e WT r-αSyn after 0 or 15 days of incubation in the presence (+) or absence (−) of CK2 or ATP was analyzed by BN-PAGE followed by immunoblotting with d anti-αSyn antibody D119 and e anti-pS129-αSyn antibody ab51253. Molecular mass markers are indicated in kDa on the left side of each panel. Arrows indicate the top of the gel. In a, b, d and e, one representative blot from three independent experiments is shown

