Fig. 7.
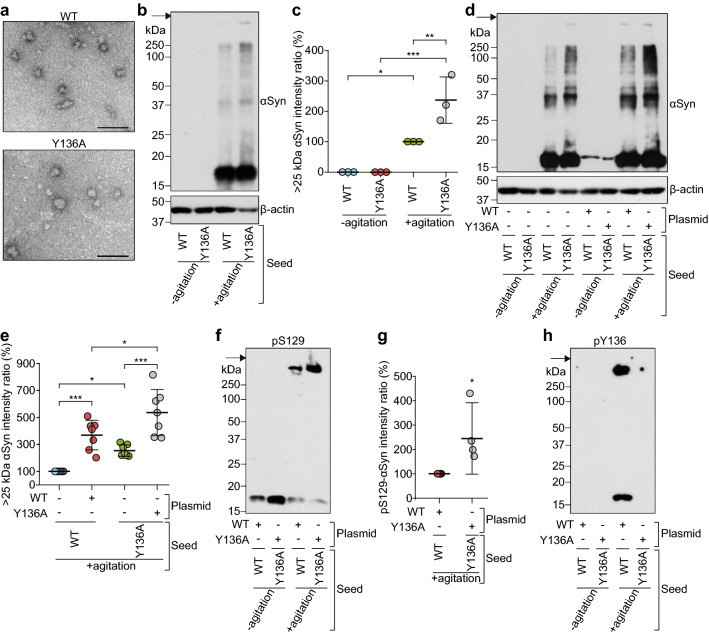
Tyr136 phosphorylation prevents aggregate formation and Ser129 phosphorylation of αSyn in cultured cells. a WT r-αSyn or Y136A r-αSyn subjected to agitation was examined by TEM. Bars, 100 nm. b–h WT r-αSyn or Y136A r-αSyn seed with (+ agitation) or without (− agitation) agitation was introduced into SH-SY5Y cells with (+) or without (−) pcDNA3.1 plasmid encoding WT or Y136A αSyn. The lysates from cells were analyzed by SDS-PAGE followed by immunoblotting with b, d anti-αSyn antibody Syn204, b, d anti-β-actin antibody, f anti-pS129-αSyn antibody D1R1R, and h anti-pY136-αSyn antibody. Molecular mass markers are indicated in kDa on the left side of each panel. Arrows indicate the top of the gel. Intensity ratios (%) of immunoreactive (c, e) αSyn > 25 kDa and g pS129-αSyn were quantified in at least three independent experiments. Data are presented as means ± standard deviation. Statistical significance was determined using c, e one-way ANOVA followed by Tukey–Kramer test and g 2-tailed Student’s t test. *P < 0.05, **P < 0.01, ***P < 0.001

