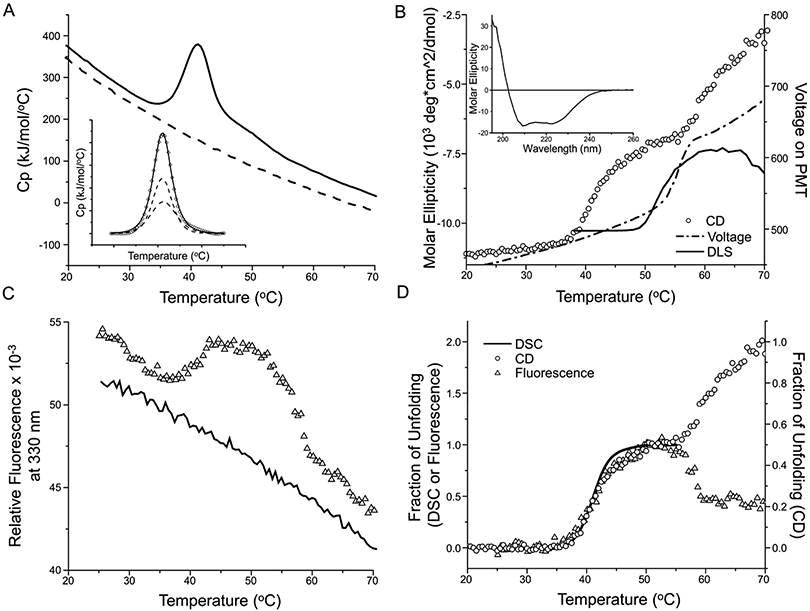
Figure 3. Thermal unfolding of detergent-solubilized Pgp.

A) DSC of 0.5 mg/ml Pgp in 20 mM HEPES, pH 7.5, 50 mM NaCl, 0.1 mM TCEP, 10% glycerol, and 2 mM (0.1% w/v) DDM. The solid line is the first scan and the dashed line is a rescan of the same sample that is used as baseline for enthalpy calculation. Insert: The unfolding peak (diamonds) can be deconvoluted into two transitions (dashed lines) and the solid line is the sum of the two transitions. B) CD signal at 230 nm (circles) of 0.1 mg/ml Pgp in a 1 cm cuvette. The dash-dotted line is the voltage applied on the PMTs, and the solid line is the light scattering (LS) determined by DLS (scaled and vertically shifted to compare with the voltage). Both the voltage and LS suggests protein aggregation. The insert shows the wavelength scan from 260 nm to 195 nm of 1 mg/ml Pgp in a 0.2 mm cuvette. C) Intrinsic fluorescence (triangles) of 0.5 mg/ml Pgp, monitored at λex = 290 nm and λem = 340 nm, in a 384 well microtiter plate. The solid line is the rescan. All samples in A-C were scanned at 1 °C/min. D) Overlay of the fraction of unfolding recorded by DSC (solid line), CD (circles) and fluorescence (triangles). The CD fraction is plotted with a different scale (shown on the y-axis at the right-hand side) so its first transition can overlay with the DSC and fluorescence transition.
