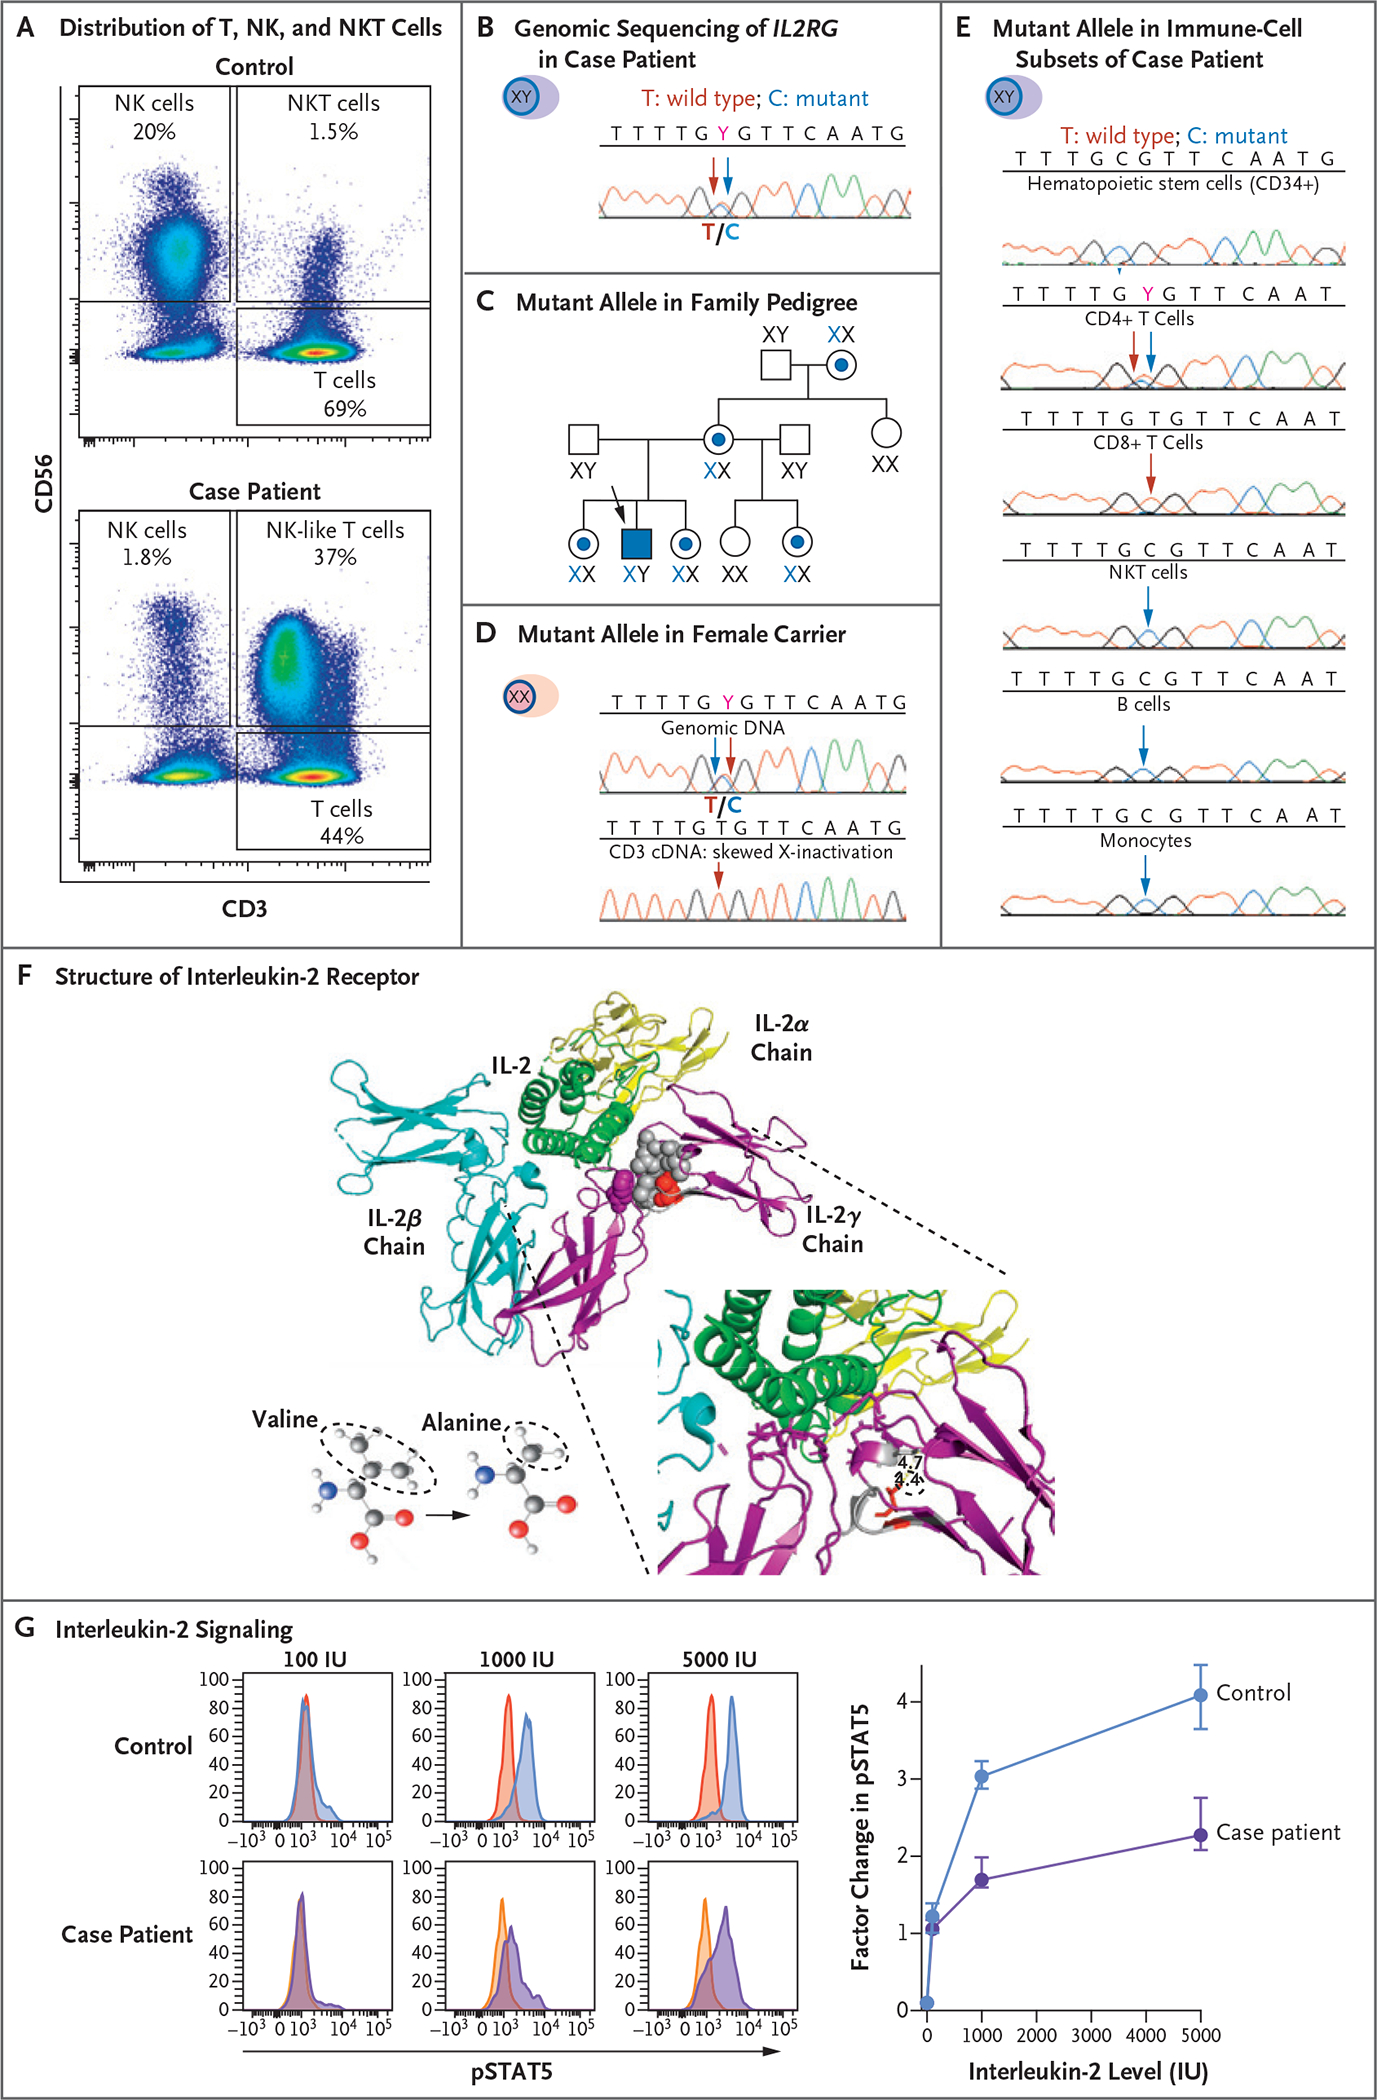
Figure 2. Genetic and Functional Analysis of the Common Cytokine Receptor γ-Chain.

Panel A shows flow cytometric analysis of the expression of CD56 and CD3 cells in peripheral-blood mononuclear cells (PBMCs) obtained from a healthy control (upper graph) and the case patient (lower graph). The analysis identifies subsets of natural killer (NK) cells and NK T (NKT) cells. The sample from the case patient shows an expansion of NK-like (CD3+CD56+) T cells and a reduced proportion of functional mature NK cells (CD3− CD56dim). Panel B shows genomic sequencing of the X-linked gene interleukin-2 receptor subunit gamma (IL2RG) in DNA extracted from PBMCs obtained from the case patient, which documents the equal distribution of the wild-type T allele (red arrow) and mutant C allele (blue arrow) at codon 191. Panel C shows the distribution of the IL2RG C allele with the c.191 mutation in the patient’s family pedigree. A blue dot and X identify female carriers of the mutant allele, and the case patient is identified by a blue square. Panel D shows the distribution of the mutant IL2RG C allele in the genomic DNA (upper graph) and in the complementary DNA (cDNA) from sorted T cells (lower graph) obtained from a female carrier in the patient’s family. Although both wild-type T alleles and mutant C alleles are present in genomic DNA from PBMCs, only the wild-type T allele appears in cDNA extracted from T cells. Panel E shows the distribution of the mutant IL2RG C allele in genomic DNA extracted from different cell subsets of the case patient. Somatic reversion of the mutated C allele appears only in CD4+ and CD8+ T cells. Panel F shows the heterotrimeric structure of the interleukin-2 receptor (IL-2R) in complex with interleukin-2 (IL-2, green ribbon). The three distinct and noncovalently linked IL-2Rα chain (yellow ribbon), IL-2Rβ chain (blue ribbon), and IL-2Rγ chain (purple ribbon) contribute to define the high-affinity IL-2 binding site. The side chain of p.64V (red spheres) in a compact hydrophobic core (gray spheres) interacting with p.227F (purple spheres) contributes to defining the IL-2 binding site. The missense variant p.V64A has a smaller side chain than the wild type. Panel G shows histograms (at left) that represent the distribution of fluorescence intensity of phosphorylated signal transducer and activator of transcription 5 (pSTAT5) after incubation of PBMCs obtained from a healthy control and from the case patient with different levels of IL-2. After gating in the subset of CD3-CD56dim functionally mature NK cells, the red and yellow histograms (which overlap and appear orange in spots) on the left side of each graph display the pSTAT5 fluorescence intensity in unstimulated condition, whereas the blue and purple histograms on the right side display the increase in pSTAT5 fluorescence after stimulation with 100, 1000, and 5000 IU of IL-2 in a representative experiment. The graph (at right) presents the cumulative data of five independent experiments presented as the median and interquartile range of the factor change in the median fluorescence intensity of pSTAT5 between unstimulated and IL-2–stimulated conditions in the case patient and in healthy controls. The reduction in the pSTAT5 factor change is consistent with reduced IL-2 signaling in the case patient as compared with two healthy controls.
