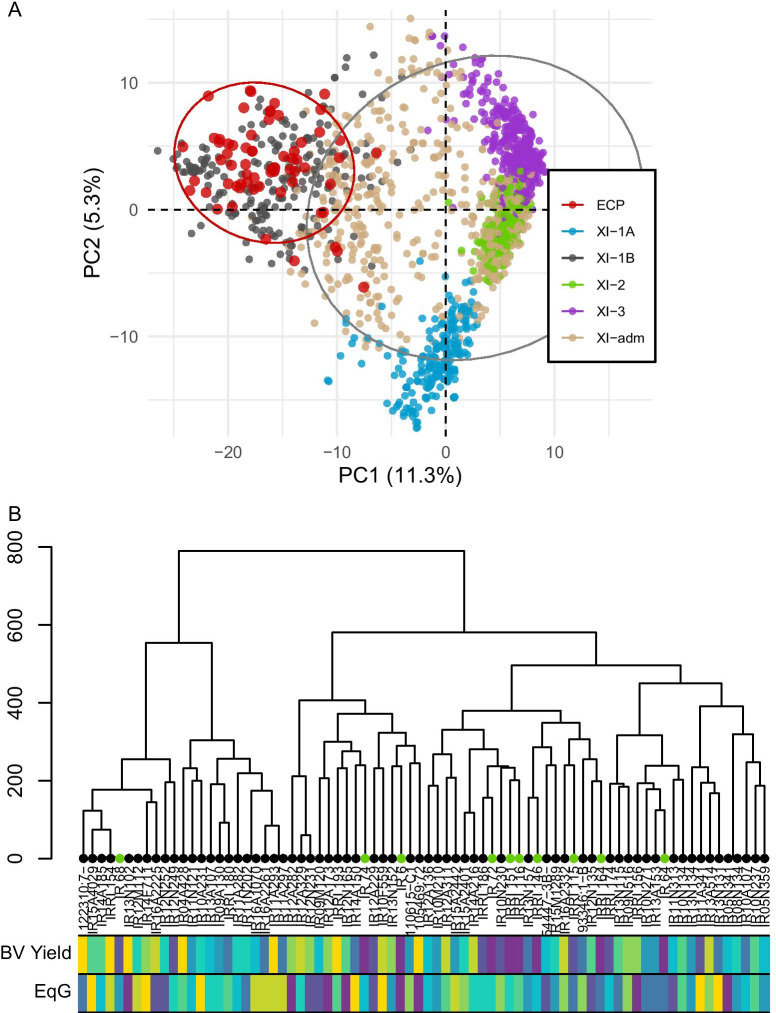
Fig. 6.
Genotypic characterization of the elite core panel (ECP) based on genome-wide SNP markers. A Principal component (PC) analysis showing the grouping of ECP with Xian/indica (XI) group from the 3K-RG lines. B Dendrogram showing the relationship between ECP lines and with IRRI varieties (green dots). The heatmap at the bottom represents the breeding value for yield (BV Yield) and the equivalent complete generation (EqG) from the lowest (purple) to the highest (yellow) deciles

