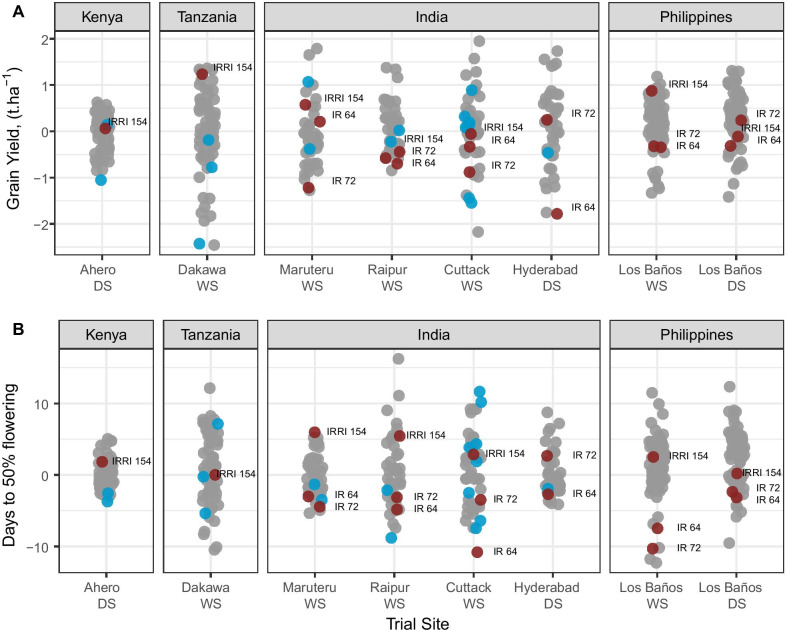
Fig. 8.
Agronomic performance of the elite core panel in multi-location field evaluations. The panel A shows the distribution of the best linear unbiased predictor (BLUP) for grain yield and the panel B shows the distribution of BLUPs for days to flowering. The BLUP values are computed for all entries in each field trial using a linear mixed model (see “Materials and Methods” section). The lines composing the core panel are in grey, local and global checks are represented in blue and red, respectively. The name of global checks is displayed next to its BLUP value. The season (WS: wet season or DS: dry season) is also provided along with the location

