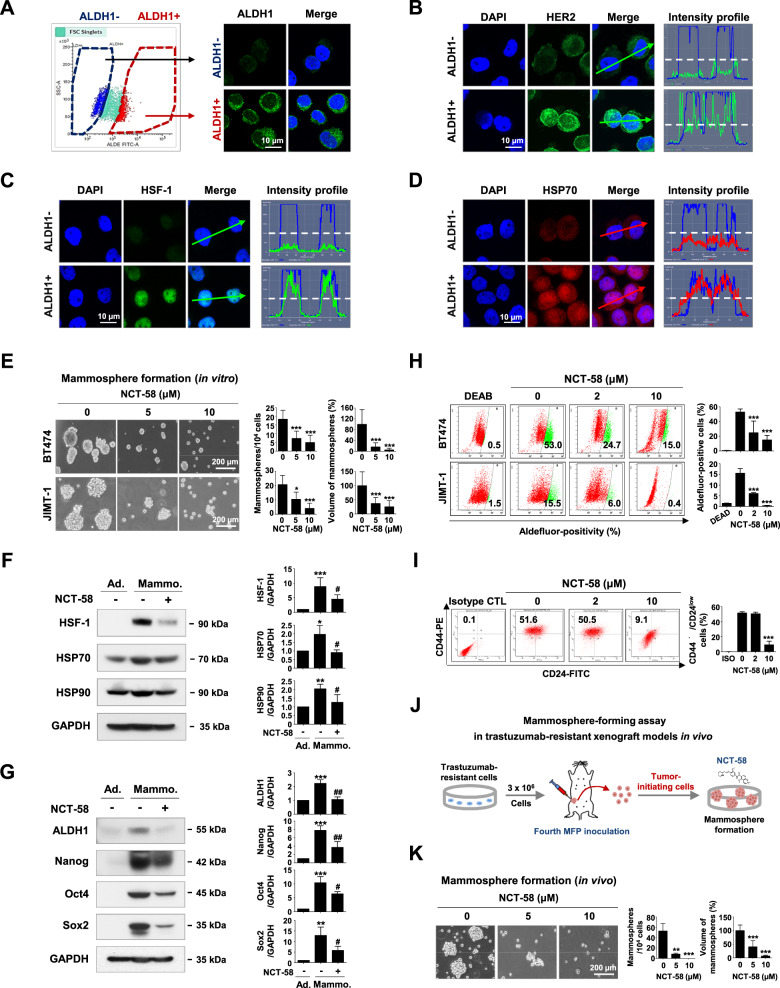
Fig. 4. NCT-58 targets HER2-positive BCSC-like properties.
A–D ALDH1 low (ALDH1-) and high (ALDH1+) populations were sorted from BT474 cells using FACS. Cells were immunostained for ALDH1 (green, A), HER2 (green, B), HSF-1 (green, C) and HSP70 (red, D) with DAPI (blue). Intensity was analyzed by confocal microscopy using the intensity profiling tool. The straight line (white dotted line) indicates 100 intensity units (y-axis on the left, a range scale 0–260 unit). E Effect of NCT-58 on mammosphere formation by BT474 and JIMT-1 cells. Cells (5 × 10⁴ cells/mL) were cultured in ultralow attachment plates in the presence or absence of NCT-58 (5 and 10 μM) for 3 and 7 days, respectively. The number and volume of mammospheres was quantified by optical microscopy (*p < 0.05; ***p < 0.001, n = 3). F–G BT474 cells were cultured in normal culture medium or serum-free suspension conditions in the presence or absence of NCT-58 (10 μM) for 3 days. F Changes in HSF-1, HSP70, and HSP90 levels as determined by immunoblotting. Quantitation of these protein levels is shown in the right panels [*p < 0.05; **p < 0.01; ***p < 0.001, adherent cells (Ad.) vs mammospheres (Mammo.); #p < 0.05, DMSO control vs NCT-58 treatment in mammospheres, n = 3]. G Expression levels of ALDH1, Nanog, Oct4, and Sox2 as detected by immunoblotting. Quantitation of the expression of these proteins is shown [***p < 0.001, Ad. vs Mammo.; #p < 0.05; ##p < 0.01, DMSO control vs NCT-58 treatment in mammospheres, n = 3]. GAPDH was used as an internal loading control. H, I Influence of NCT-58 (2–10 µM, for 72 h) on ALDH1 activity in BT474 and JIMT-1 cells and CD44high/CD24low stem-like phenotypes in JIMT-1 cells. Quantitative graph of percentages of Aldefluor-positivity (H, ***p < 0.001, n = 3) or CD44high/CD24low populations (I, ***p < 0.001, n = 3) are shown, respectively. J, K Impact of NCT-58 on mammosphere formation in a JIMT-1 xenograft model. Dissociated single cells (5 × 10⁴ cells/mL) from xenograft tumors (200–250 mm3) were plated in ultralow attachment dishes and cultured in the presence or absence of NCT-58 (5 and 10 μM) for 8 days. The number and volume of mammospheres was quantified (**p < 0.01; ***p < 0.001, n = 3). The results are presented as mean ± SD of at least three independent experiments and analyzed by one-way ANOVA followed by Bonferroni’s post hoc test.

