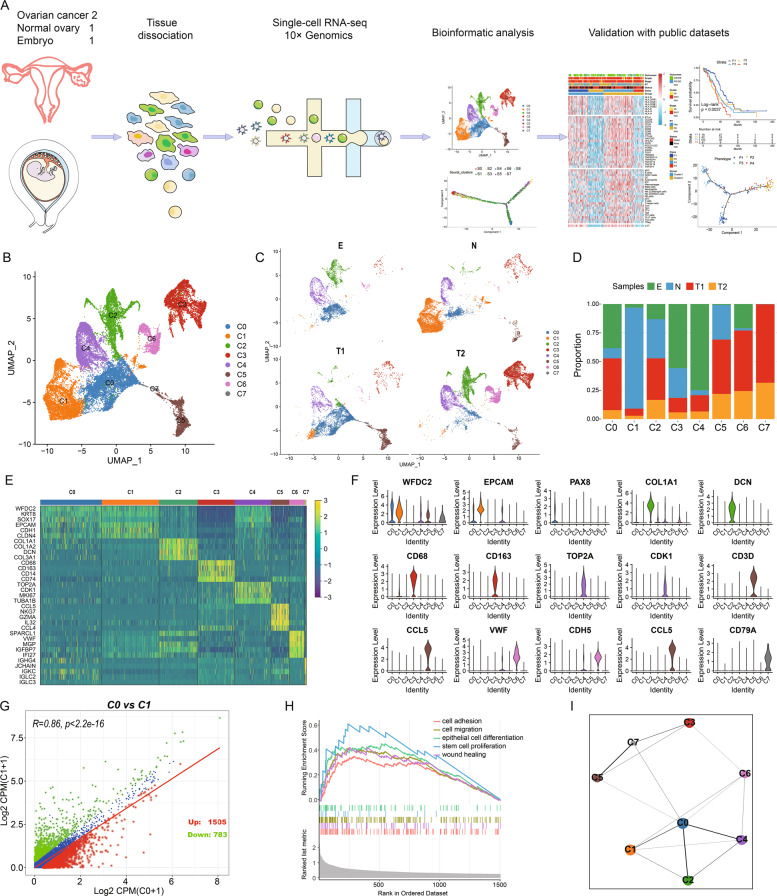
Fig. 1. Integrated analysis of OCs and embryonic single-cell transcriptomes.
A Workflow illustrating collection and processing of single-cell transcriptome of OCs, control ovary, and embryo. B, C OCs and embryo cell clusters from 10× Genomics scRNA-seq analysis visualised by UMAP. D The proportion of diverse cell types across different samples. E Heatmap displaying the expression patterns of specific markers in each cell type. F Violin plots exhibiting the expression of representative markers across diverse cell types. G Scatter plots showing the gene expression patterns of type C0 (x axis) and C1 (y axis). H GSEA analysis of C0 displaying its’ malignant characteristics. I Relationship of C0 and other cell types.

