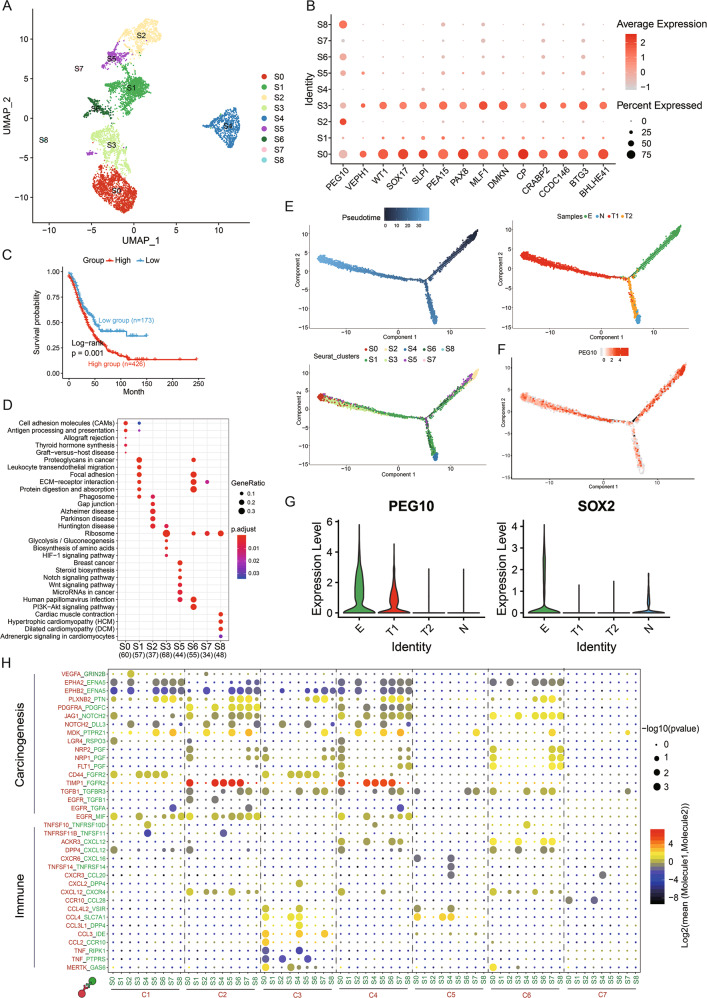
Fig. 3. Differential gene expression profiles of diverse clusters of C0.
A UMAP representation of nine subgroups generated from C0. B Dotplot illustrating the representative genes across diverse cell types. C Kaplan–Meier curves for patients with high- and low-GSVA score (based on top 100 markers of S3) in GEO OC meta data sets (Log-rank p = 0.0099). D Functional analysis of each subtype is illustrated with KEGG. E Pseudotime of nine subtypes and four samples in C0 inferred by Monocle2. Each point corresponds to a single cell. Clusters or samples information are shown. F Expression of PEG10 was mapped to the single-cell trajectory plot. Colour from grey to red indicates relative expression levels from low to high. G Violin plots illustrating the mRNA levels of PEG10 and SOX2 in samples based on cells in S3. H Heatmap of selected ligand–receptor interactions between diverse cell types and subtypes of C0. Point size indicates p value (CellPhoneDB). Colour indicates the mean expression level of ligand and receptor (Mol1/2).

