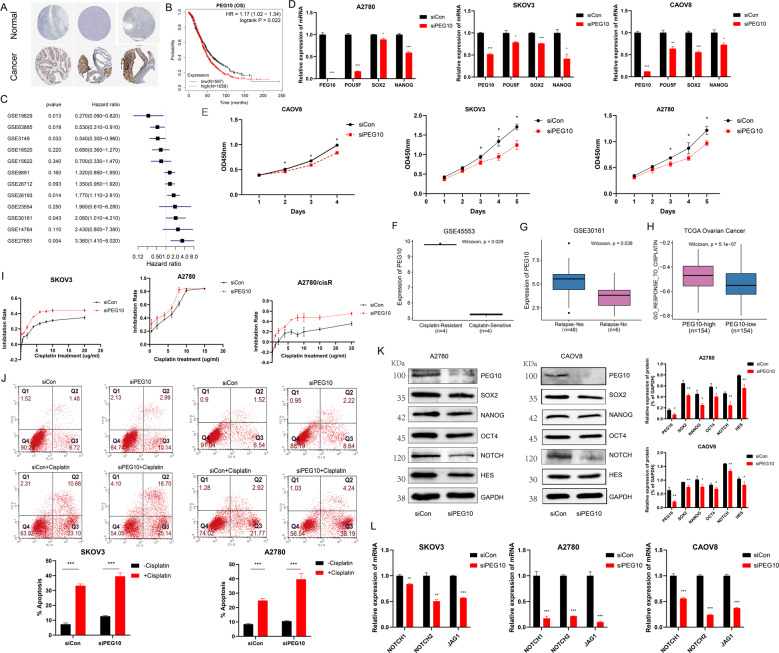
Fig. 4. PEG10 deficiency inhibits tumour cell proliferation and promotes cisplatin resistance by targeting stem cell self-renewal.
A Representative protein expression levels of PEG10 were high in OCs based on the Human Protein Atlas database. B Patients with higher PEG10 illustrated poor OS based on Kaplan–Meier plotter data set. The cut-off of PEG10 was 1038 to dichotomise OC patients. C Forest plot showing PEG10 is associated with poor OS in most OC data sets. D Barplots demonstrating mRNA expression of SOX2, NANOG, and POU5F were lower in siPEG10 cells. E Downregulation of PEG10 inhibited OC cell proliferation. F, G Boxplot illustrating higher PEG10 in cisplatin resistant (F) and relapse (G) group based on GEO data sets. H GSVA of GO_RESPONSE_TO_CISPLATIN in the high- and low-PEG10 group. I Cisplatin sensitivity in siCon and siPEG10 OC cells. J Apoptotic cells by flow cytometry in control and siPEG10 OC cells untreated or treated with cisplatin. K Protein levels of PEG10, SOX2, NANOG, OCT4, NOTCH, and HES were also lower in siPEG10 OC cells. L mRNA levels of NOTCH1, NOTCH2, and JAG1 were lower in the siPEG10 group compared to the siCon group. *represented p < 0.05, **represented p < 0.01, ***represented p < 0.001.

