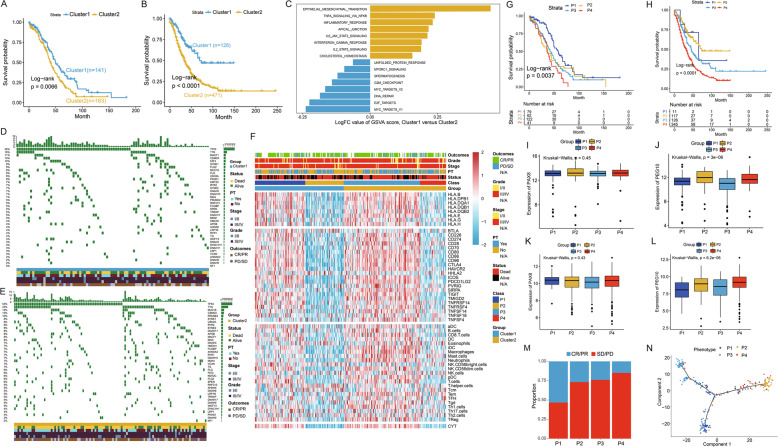
Fig. 5. Four phenotypes identified based on markers of carcinoembryonic subtype.
A, B Kaplan–Meier curves for Cluster1 and Cluster2 based on TCGA OC cohort (A) and GEO OC meta data sets (B). C GSVA analysis of two clusters. D, E Waterfall chart illustration of top 40 mutated genes in the two clusters in OC. A limited number of mutations were in Cluster1 (D); more mutations existed in Cluster 2 (E). F Heatmap representation of immune molecules in four classes in TCGA OC cohort. G, H Kaplan–Meier curves for patients with four distinct phenotypes in TCGA OC cohort (Log-rank p = 0.0037, G) and GEO OC meta data sets (Log-rank p < 0.0001, H). I–L Boxplot illustrated the expression of PAX8 (I, K) and PEG10 (J, L) in four phenotypes based on TCGA OC cohort and GEO OC meta data sets. M Ratio of clinical response (CR/PR and PD/SD) to anti-PDL1 immunotherapy in four immune phenotypes based on IMvigor210 cohort. N Pseudotime of four phenotypes in TCGA OC cohort inferred by Monocle2. Each point corresponds to one OC sample. Phenotype information is shown.

