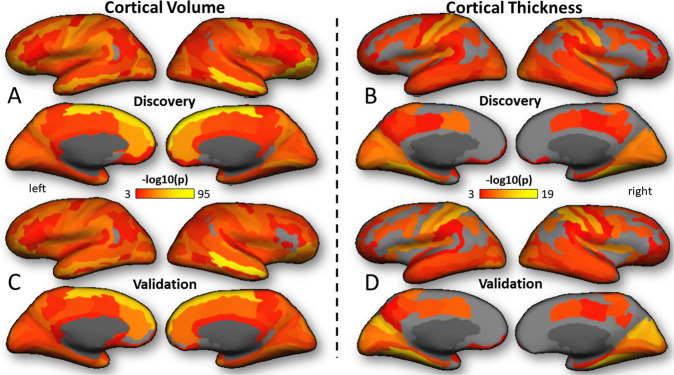
Fig. 3. Regional effects of family income (FI) on cortical volume and thickness.
Cortical renderings of statistical significance for the effect of FI on brain morphometrics showing the pattern of the effect in the Discovery (A, B) and Validation (C, D) samples. Factorial ANCOVA with nine factors of interest (FI, risk of lead exposure, excess weight, siblings, screen media activity, parental education, sex, age, and area deprivation index), and four covariates of no interest (race, intracranial volume, scanner manufacturer, and intra-scan head motion).

