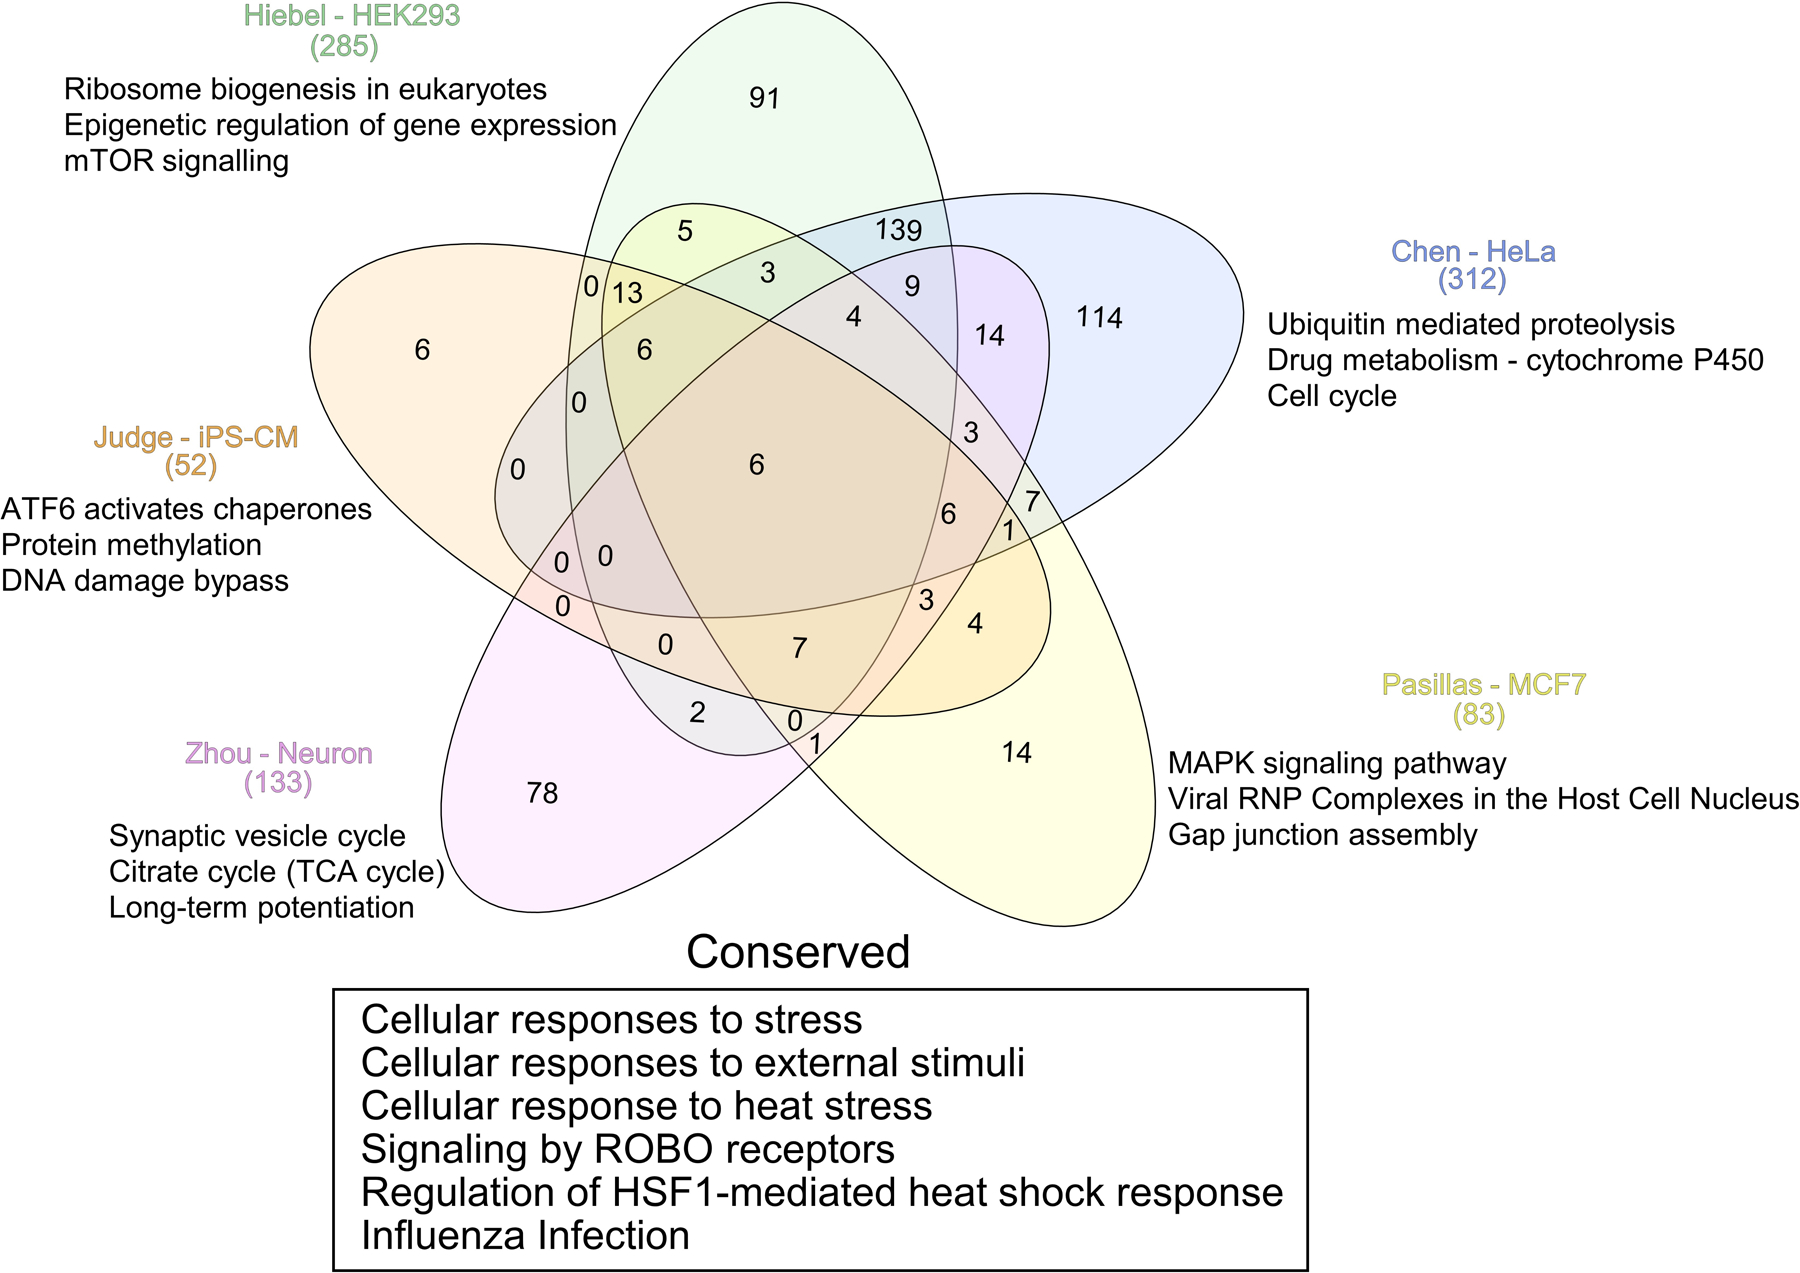
Figure 2. Pathway meta-analysis of BAG3 associated proteins.

Five separate IP-MS studies assessing protein co-immunoprecipitation with BAG3 were compared and analyzed through gProfiler to determine the statistically significant pathways over-represented by BAG3 interacting proteins across cell types. An FDR p value cutoff of 0.05 was used to determine statistically significant pathway over-representation. KEGG and Reactome annotations were considered. A Venn diagram was produced using InteractiVenn (Heberle, Meirelles, da Silva, Telles, & Minghim, 2015).
