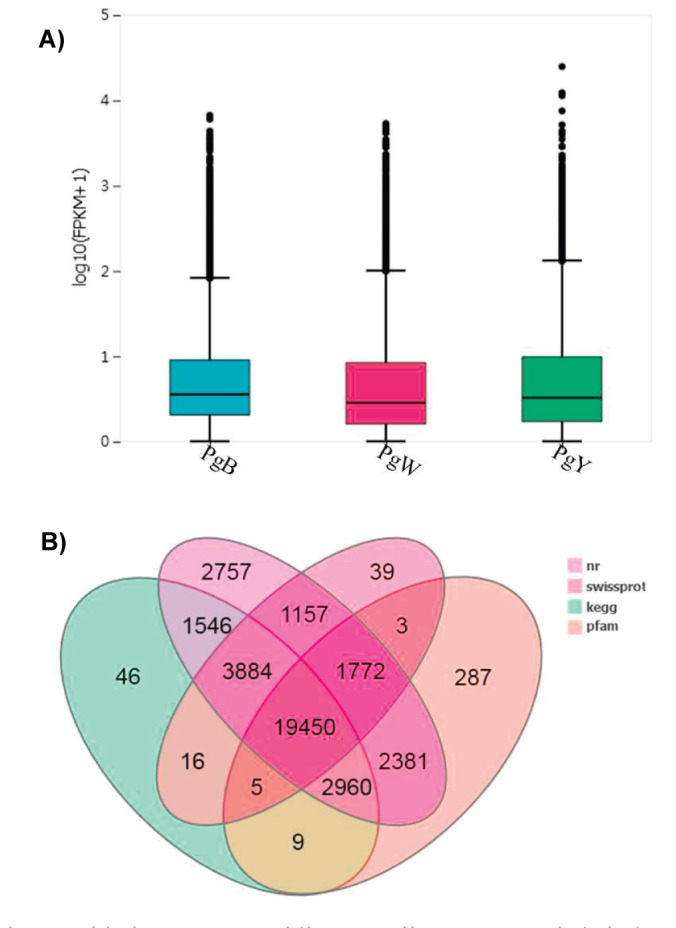
Figure 2.

Profile of assembled unigenes and the overall expression distribution. A) Expression pattern of the uningenes from three samples. Median values for PgB, PgW and PgY were 0.55, 0.46 and 0.51, with upper quartile 0.96, 0.93 and 0.99. B) Annotations for all unigenes against public databases.
