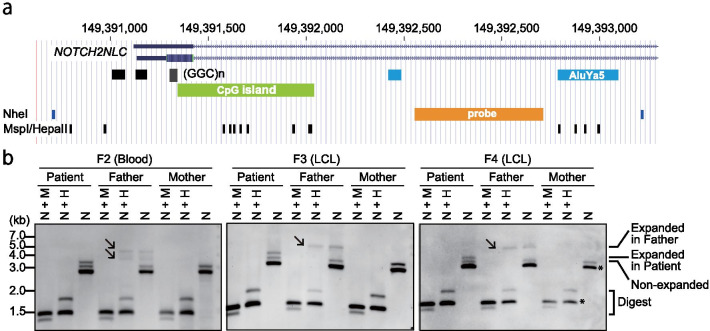
Fig. 3.
Southern blot analysis showing the differential DNA methylation status of the NOTCH2NLC region. a Physical map of the NOTCH2NLC region with the NheI, MspI/HpaII restriction enzyme sites and Southern blot probe. Chromosome positions are based on hg38 assembly. Black, green, blue and orange rectangles represent (GGC)n/(GGCGGA)n, CpG island, SINE and Southern blot probe, respectively. b Genomic DNA extracted from blood samples (F2 family) and LCLs (F3 and F4 families) were digested by the restriction enzyme indicated in the figure panel. N + M: NheI and MspI; N + H: NheI and HpaII; N: NheI. Note that expanded alleles in the father’s sample are resistant to restriction digestion by the methylation-sensitive endonuclease HpaII (arrow). Asterisk: cross hybridization to the NOTCH2NLC homologous genes, NOTCH2, NOTCH2NLA, NOTCH2NLB and NOTCH2NLR. Note that two prominent signals (arrows) were detected in the blood sample from the F2-father, but only one signal (arrow) was detected in LCLs of the F3-father and F4-father, indicating somatic mosaicism

