Fig. 5.
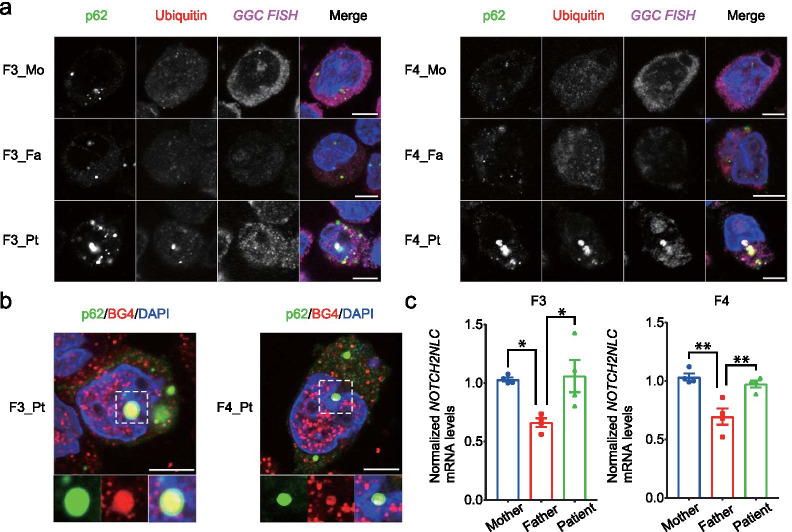
Pathological study of NOTCH2NLC GGC repeat expansion. a immunofluorescence and RNA FISH experiment showing nuclear inclusions with GGC RNA foci. Representative images of p62 (green), ubiquitin (red), fluorescent probe of (GGC)8 (magenta) and DAPI (blue) in LCLs derived from F3 (left) and F4 (right) families. b Immunofluorescence experiment showing co-localization of G4 foci and intranuclear inclusions. Representative images of p62 (green), BG4 (red) and DAPI (blue) in LCLs of the F3-patient and the F4-patient. All scale bars: 5 μm. c RT-qPCR experiment for NOTCH2NLC expression. mRNA levels of NOTCH2NLC were significantly decreased in LCLs from each father compared with the corresponding mother and the corresponding patient (n = 4 per group). Error bars represent SEM. *p < 0.05, **p < 0.01

