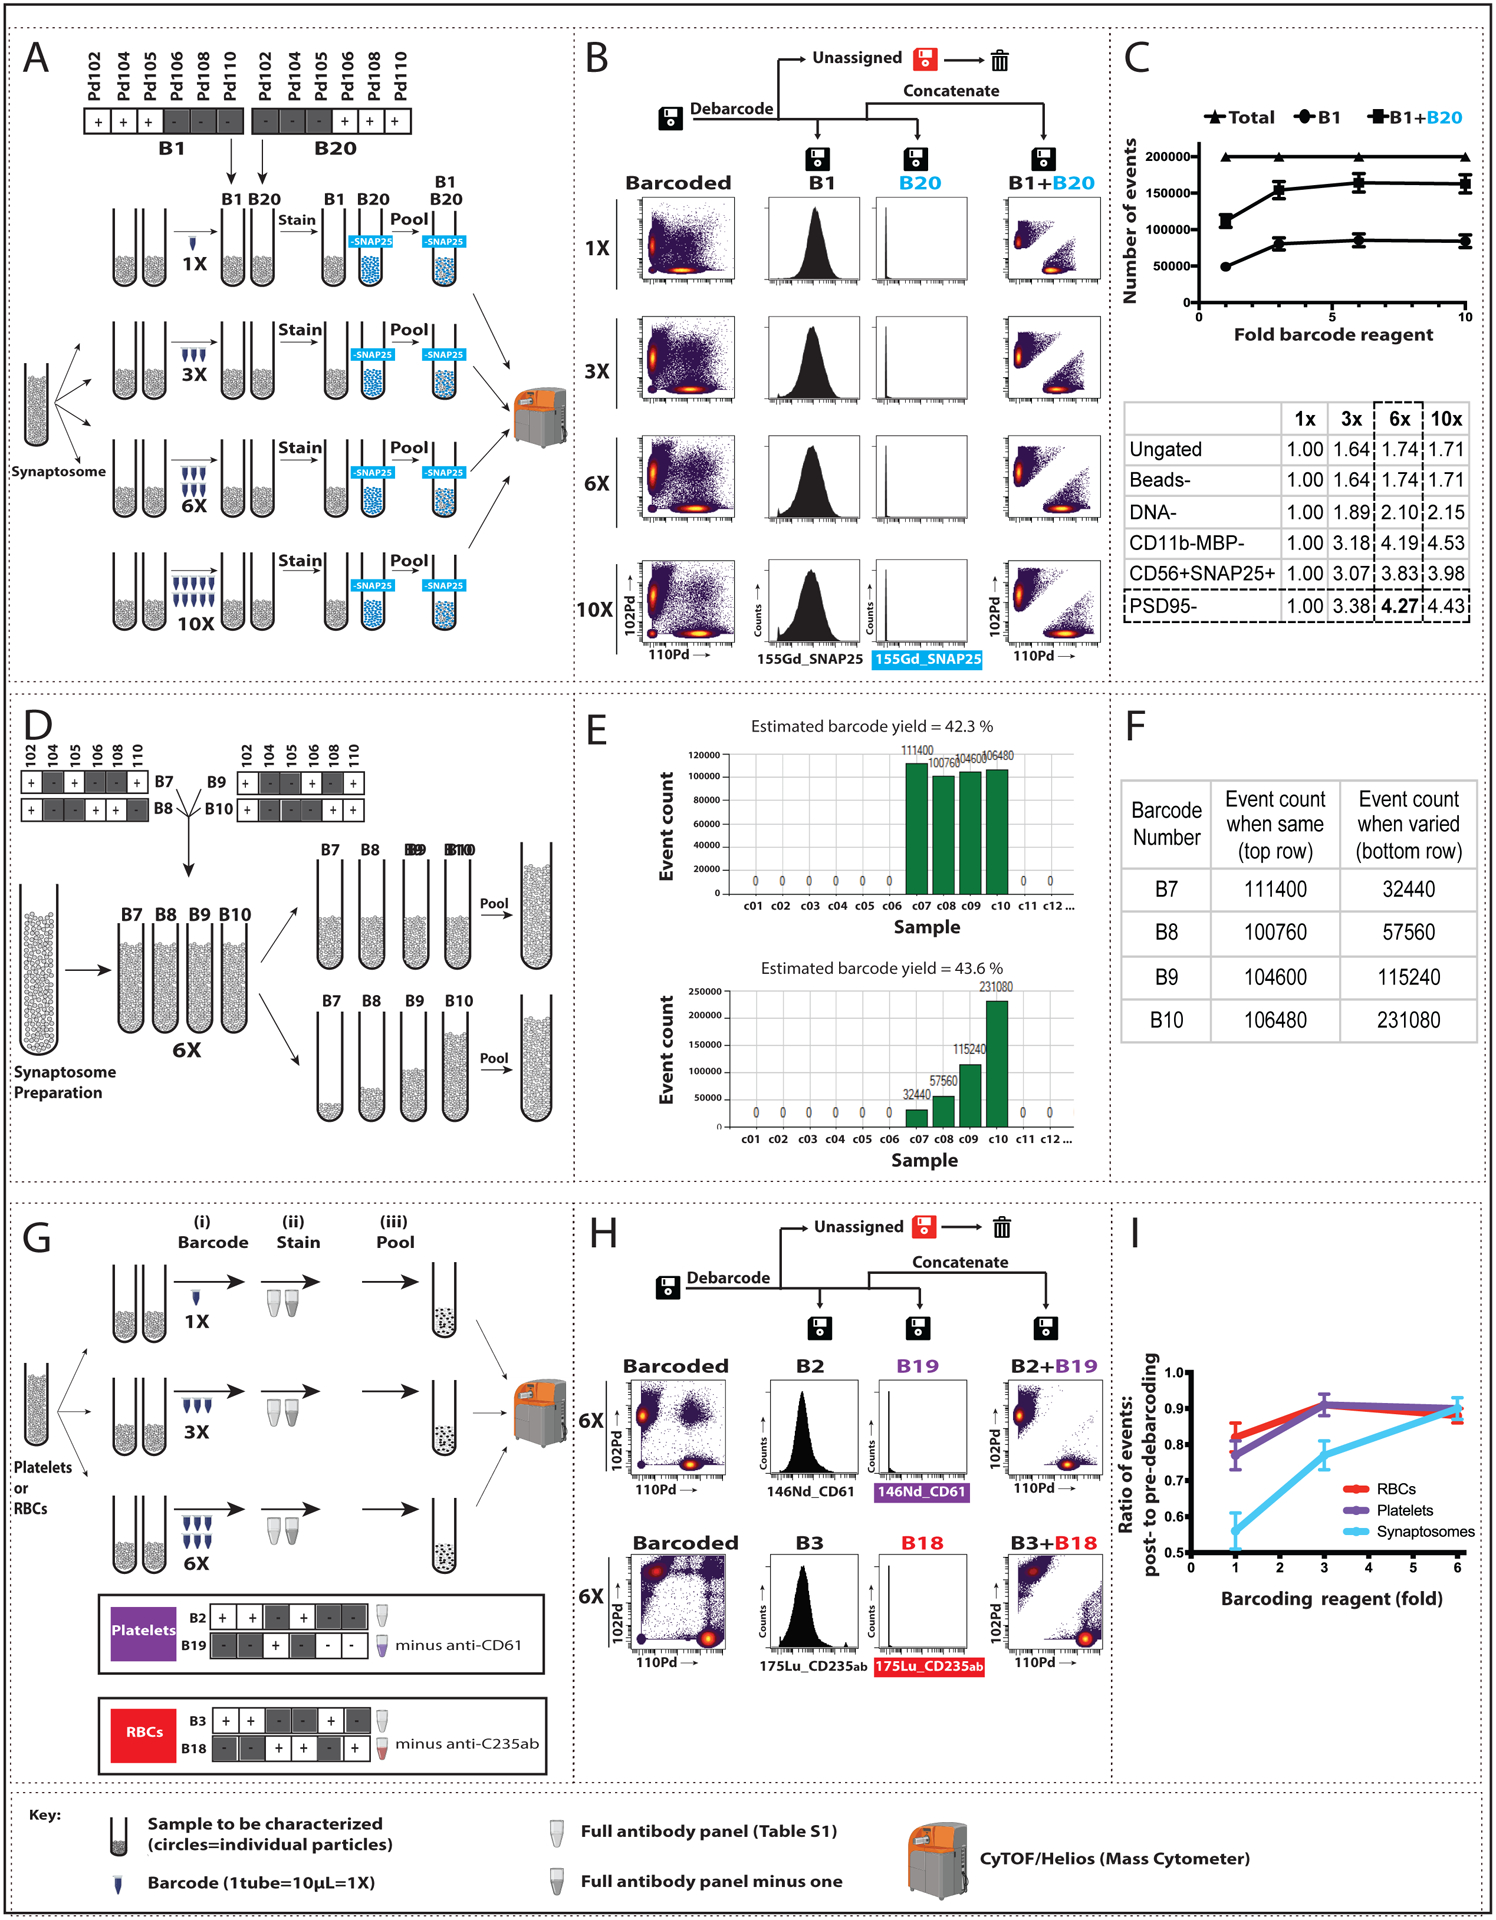
Fig. 1: Pilot barcoding of small, anuclear particles using 2 or 4 complementary barcodes.

For synaptosomes, we increased barcode reagent concentration (A-C) and varied the ratio of barcoded samples (D-F). We also tested barcoding in platelets and red blood cells (RBCs) (G-I). The full lanthanide-based antibody panel used is found in Table S1; modifications are noted below. (A) Four pairs of aliquots from a single synaptosome sample, each containing ~10^6 particles, were mixed with varying amounts of barcoding reagent (1X, 3X, 6X, or 10X) to a final volume of 1 ml. Barcode 1 (B1) samples at each concentration were labeled with the full antibody panel, and B20 samples were labeled with the same panel minus anti-SNAP25. The paired tubes at each barcode concentration were pooled, processed, and analyzed by mass cytometry (CYTOF). (B) Left: Biaxial plots show Pd102 (B1) vs Pd110 (B20) events for each barcode reagent concentration prior to debarcoding (“Barcoded”). Center: Debarcoding to three .fcs files (B1, B20), and “Unassigned” [i.e., showing conflicting barcode patterns]) demonstrated the expected presence (B1) or absence (B20) of SNAP25 signal, plotted here as event count vs. expression of 155Gd_SNAP25. Right: Pd102 vs Pd110 events following concatenation of the B1 and B20 files. (C) Top: From a total of 200,000 events for each concentration tested, the number of assigned events (B1+B20) increased up to 6X barcode concentration, spread approximately equally between B1 and B20. Bottom: The increased event count in B1 (expressed as fold-increase from 1X barcoding reagent) persisted across synaptosome sequential gating steps (described in Fig S1). (D) Four aliquots from a single synaptosome sample, each containing ~10^6 particles, were barcoded with 6X concentration of B7, B8, B9, or B10. Equal (top) or varying (bottom; 1:2:4:8) volumes from each tube were pooled, and the combined samples were labeled with the full antibody panel, processed, and analyzed by CyTOF. Representative plots of signal intensities are shown in Fig. S4. (E–F) Screenshot of output graph (E) and corresponding values (F) of event count vs. sample barcoded with B7–B10 (shown on the x-axis as c7–c10) from equal (top) and varying (bottom) samples. (G) Increased barcode reagent concentration was tested for platelets and RBCs using the same steps as shown in Panel A for synaptosomes (see Figs S2 and S3 for additional details). In brief, three pairs of aliquots from a single platelet or RBC sample were barcoded 1X, 3X, or 6X of non-overlapping barcodes (B2 and B19 for platelets; B3 and B18 for RBCs) and labeled with either the full antibody panel or the panel minus one antibody (anti-CD61 for platelets and anti-CD235ab for RBCs). Paired tubes were pooled, processed, and analyzed by CyTOF. (H). Left: Biaxial plots show Pd102 vs Pd110 events at 6X barcode reagent concentration prior to debarcoding (“Barcoded”) for platelets (top) and RBCs (bottom). Center: Debarcoded files confirm the presence (B2 or B3) or absence (B19 or B18) of antibody signal in the appropriate samples, plotted here as event count vs. 146ND_CD61 for platelets and 175Lu_CD235ab for RBCs. Right: Pd102 vs Pd110 events following debarcoded file concatenation. (I) Ratio of post- (right in Panel H) to pre- (left in Panel H) debarcoding events for the 3 barcode reagent concentrations tested in platelets and RBCs. Synaptosome data is shown for comparison. Data plotted are mean ± SEM, n=3.
