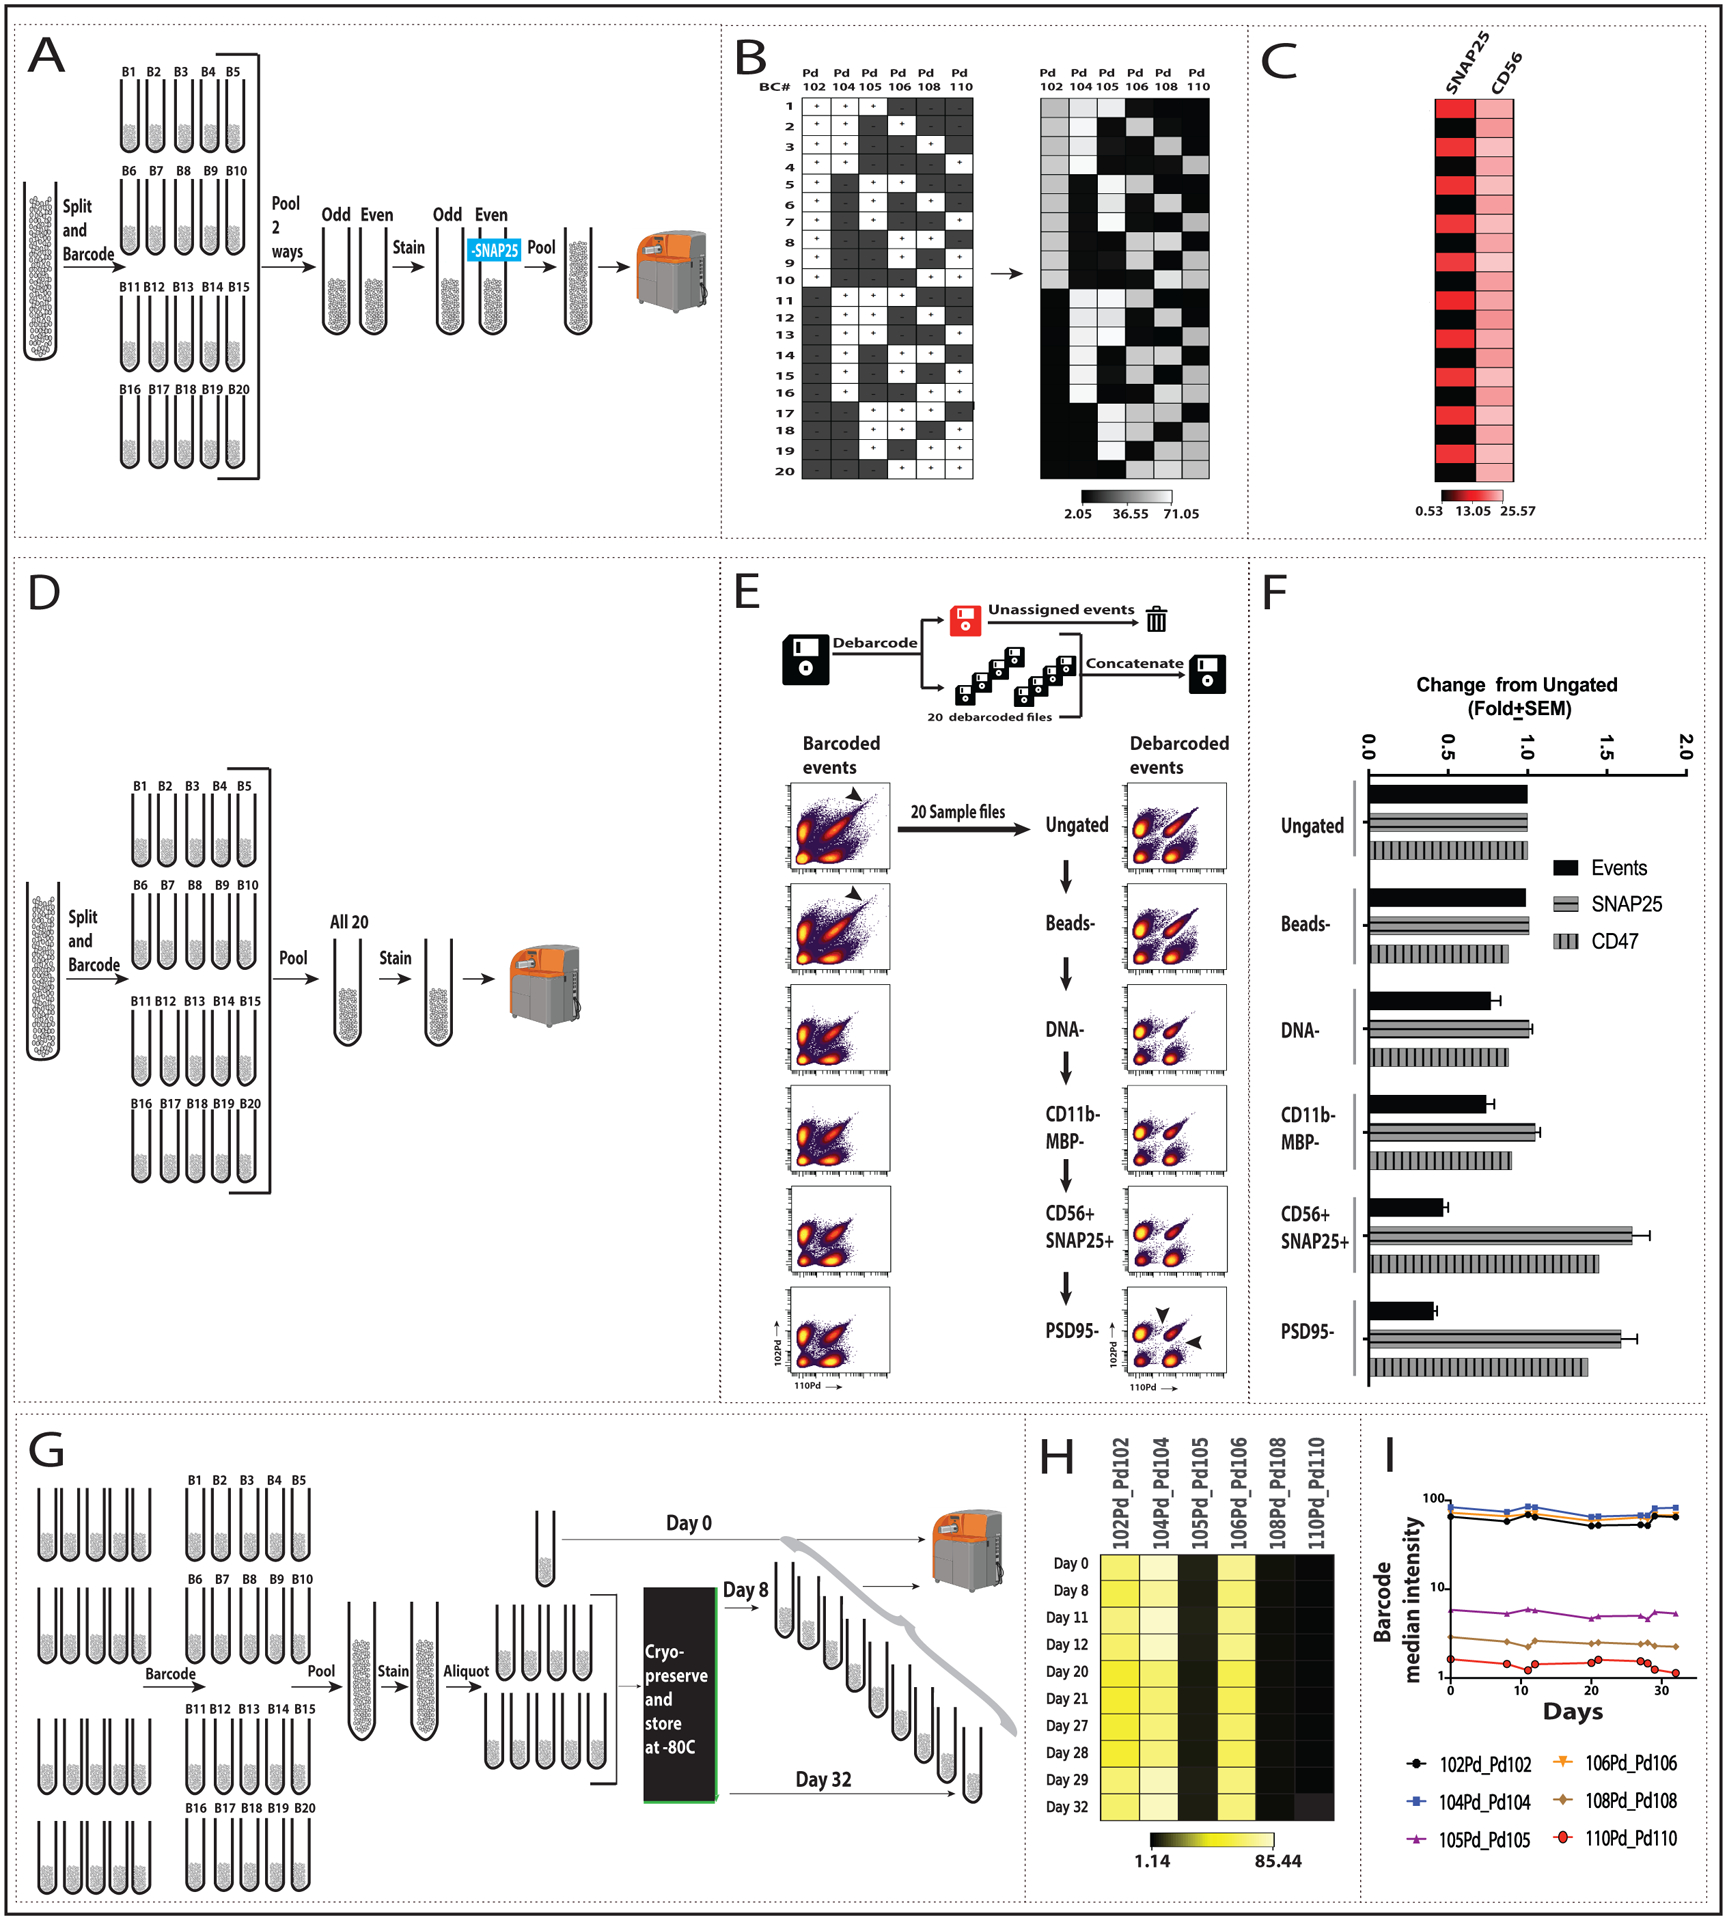
Fig. 2: Human synaptosome barcoding/debarcoding using the full set of 20 barcodes.

(A) 20 synaptosome aliquots from a single synaptosome preparation were individually barcoded with the full barcode kit at 6X concentration each. Ten odd or even numbered samples were pooled. The odd-numbered sample was labeled with the full antibody panel (Table S1) and the even numbered sample with the full panel minus SNAP25. Odd and even samples were pooled before CyTOF analysis. (B) Heat map showing median intensity of palladium isotopes for debarcoded samples with the 6-choose-3 pattern shown for reference. White “+” boxes indicate presence and black “−” boxes indicate absence of the corresponding metal tag. (C) Signal for antibodies against highly expressed antigens, SNAP25 and CD56 (see also Fig S5A). Medians for plus and minus SNAP25: 15.0±0.5 and 0.6 ± 0.1, respectively. Median across all samples for CD56: 23.8 ± 1.0. (D) Same steps as in A, except all 20 tubes were pooled. (E) Sequential gating was applied to the pre- (left) and post- (right) debarcoded data. Details of the gating steps can be found in the Methods and Figure S1. Biaxial plots show Pd102 v Pd110 for each gating step for the two datasets (see Fig. S5B for SNAP25+ and CD47 events). (F) Fold-change from ungated events is plotted for total, SNAP25+ and CD47+ events across sequential gating of debarcoded samples. (G) Cryopreservation of barcoded, antibody-labeled synaptosome preparations: aliquots of barcoded, antibody-labeled samples were either analyzed by CyTOF (Day 0, n=7) or cryopreserved (see Methods), stored at −80, thawed on the indicated day, run, and analyzed as before. (H) Heat map and (I) line graph of representative debarcoded and gated samples show barcode median intensity over days 0 to 32 (see Fig S5C for SNAP25, CD47, and CD56 data).
