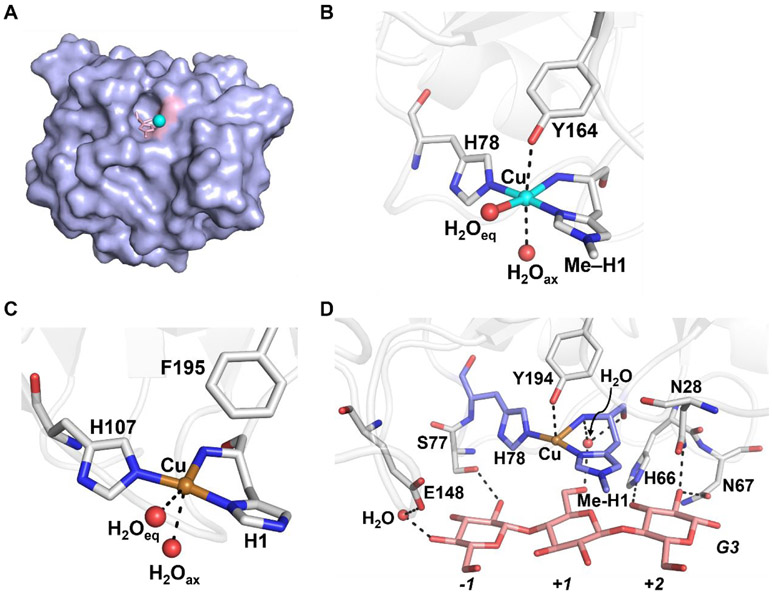
Figure 15.
Crystallographic data for LPMOs. Surface representation of AA9 showing the protein in purple and the active site in pink (A), and the molecular structures of a fungal LPMO (AA9, PDB: 5ACG) (B), a bacterial LPMO (AA10, PDB: 6RW7) (C), and an AA9 in the presence of substrate analog (G3, pink, PDB: 5ACJ) (D). Secondary coordination sphere interactions are represented by dashed lines. Cu(II) is shown as a cyan sphere and Cu(I) is shown as a brass sphere.

