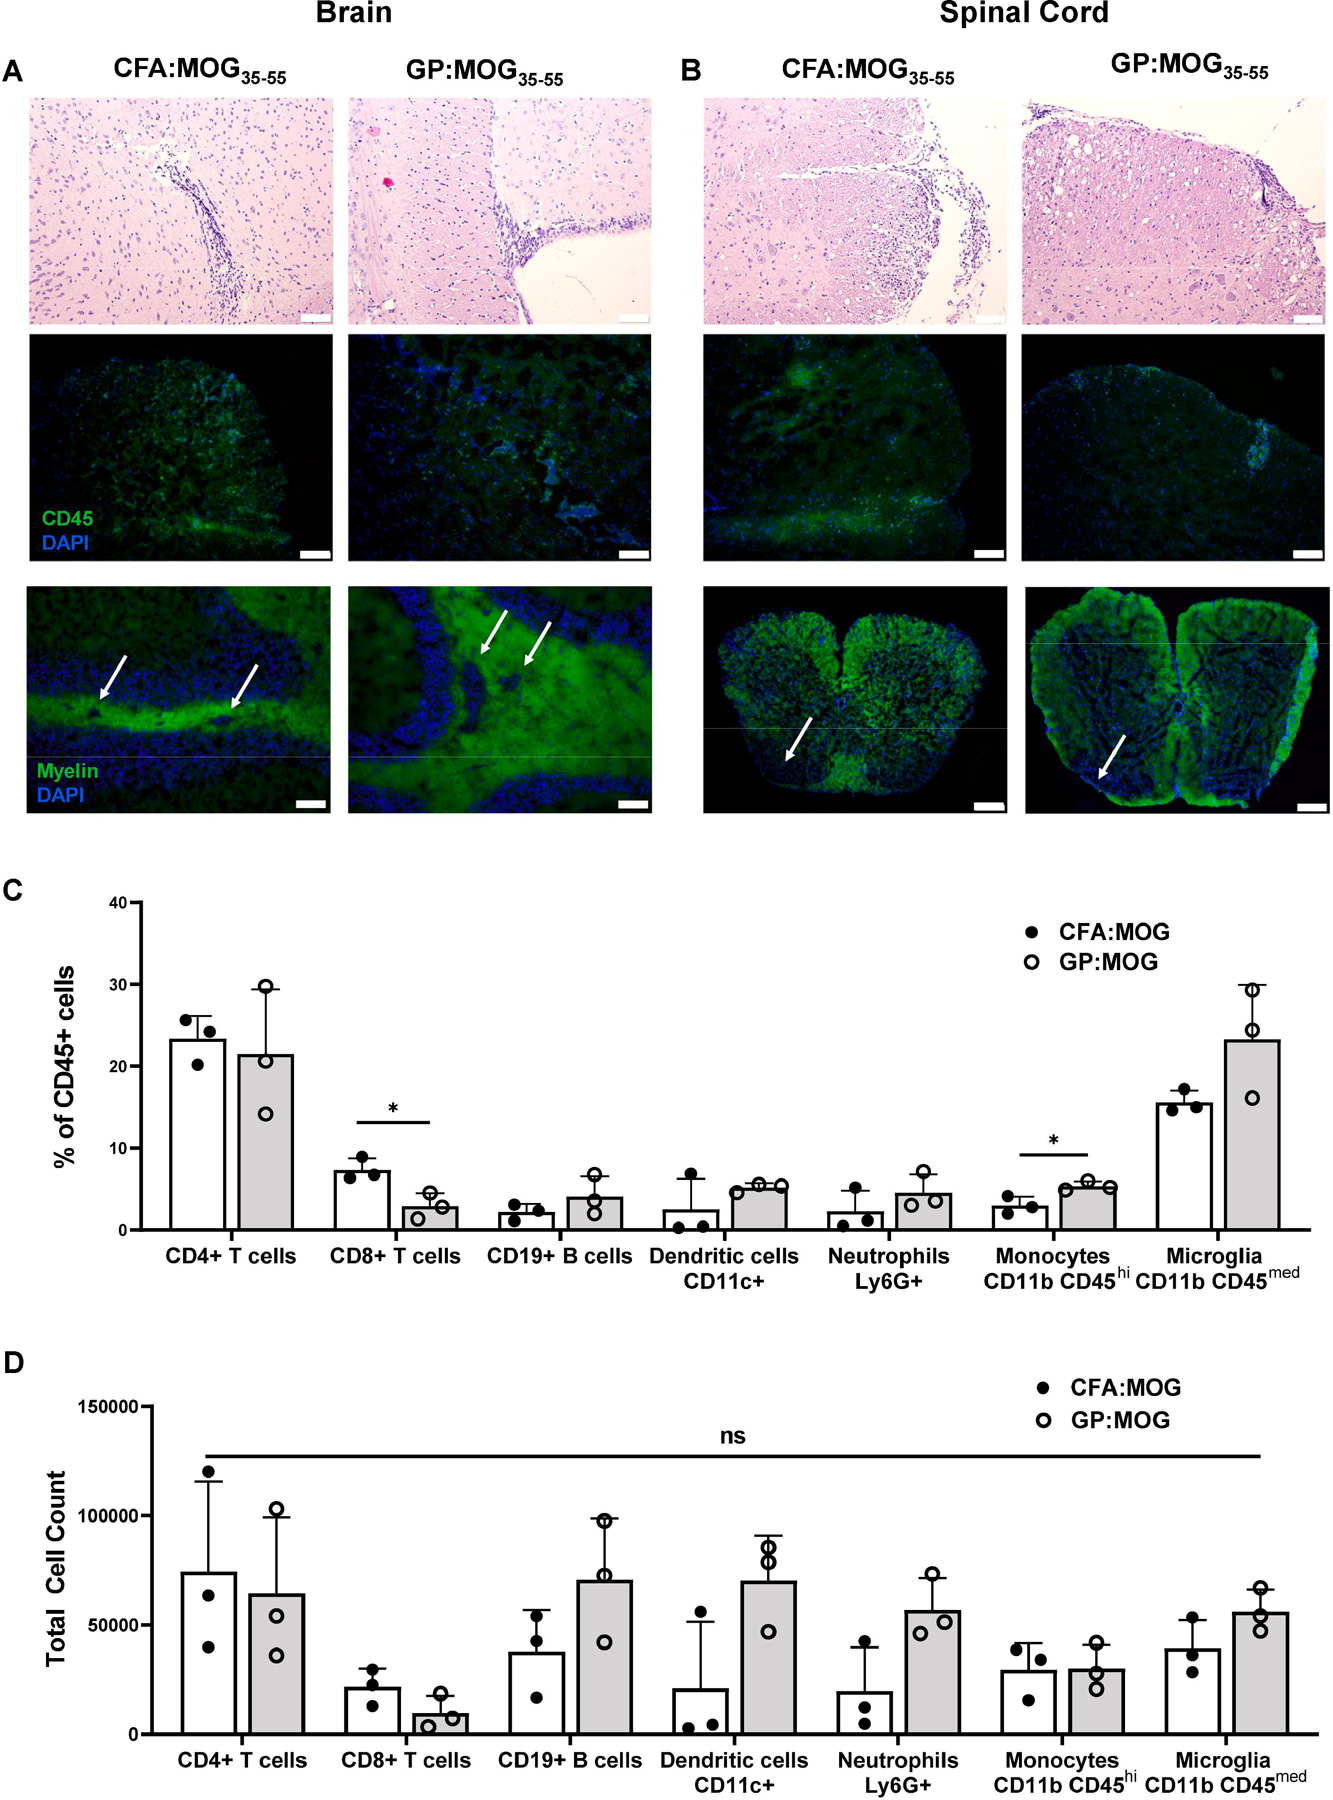
Figure 3. CNS histopathology is comparable between EAE disease induced with CFA:MOG and GP:MOG.

Inflammatory infiltrates, lesions, and demyelination in the CNS were characterized by H&E staining (top), IF staining for CD45 (middle), and myelin staining (bottom) in both the (A) brain and (B) spinal cord tissues collected day 20 post immunization. Top, middle, and bottom left scale bars represent 100 μm and bottom right scale bars represent 200 μm. (C) Composition of singlet CD45+ cells as measured by flow cytometry of brain tissues day 30 post immunization are compared between the CFA:MOG35–55- and GP:MOG35–55-immunized mice. (D) Total cell numbers of immune population in the brain day 30 post immunization compared between CFA:MOG35–55- and GP:MOG35–55-immunized mice. Bars represent mean ± SD and data are from one study representative of three independent flow cytometry experiments, n=3 per group for each experiment. (unpaired t-test performed for each cell type, * p <0.05)
