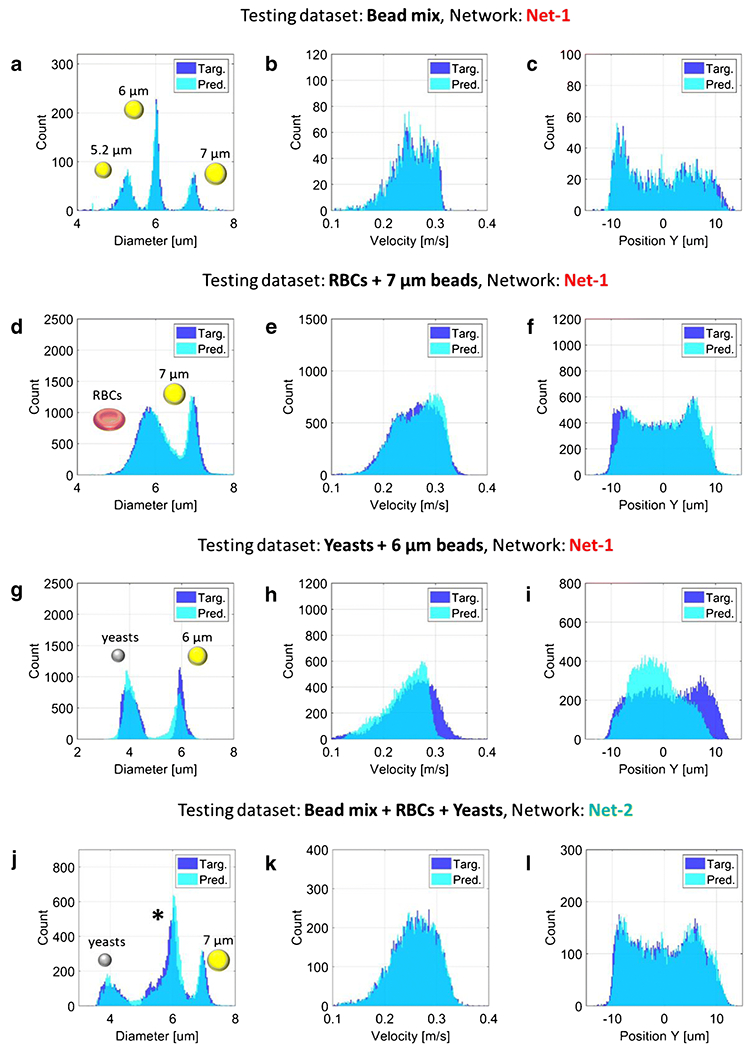
Figure 5:

(a)-(i) Testing of the neural network Net-1 on: (a)-(c) a mixture of beads (5.2, 6 and 7 μm diameter), (d)-(f) red blood cells spiked with 7 μm beads, and (g)-(i) yeasts cells spiked with 6 μm beads, (j)-(l) Testing of the neural network Net-2 on a mixture of beads, red blood cells and yeast cells. In panel (j) the central population, marked with an asterisk, comprises 5.2 μm and 6 μm diameter beads and RBCs. The latter could be distinguished from beads by means of electrical opacity (e.g., [7]). The histograms of diameter, velocity and vertical position are reported in the first, second and third column, respectively. RBC diameter indicates the diameter of a sphere with the same volume. Root mean squared error values of predicted versus target features are reported in Table 1.
