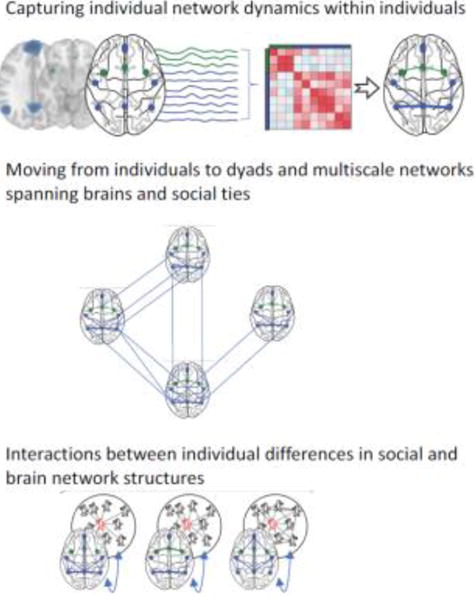
Figure 1. Building hypotheses bridging brain networks and social networks.

How can we move from typical data collected in a neuroimaging experiment to a multiscale network? Neural regions of interest (e.g., blue and green dots in the top panel) can be treated as nodes in a network, connected to one another by estimates of white matter structure or by estimates of functional connectivity such as a Pearson correlation between pairs of regional mean BOLD time series (e.g., in the top panel, the blue and green lines represent the timeseries from each region of interest over the course of a task in an MRI scanner; see also Box 1). By encoding these relationships in a connectivity matrix (depicted in shades of red in the top panel), one can first determine the strength of connectivity between brain regions in a single individual during different task conditions (in the top panel, the weight of the edges connecting the regions of interest in the right-most brain image represents the strength of the correlation between the timeseries of those nodes). Creating such a matrix can also address hypotheses not only about individuals acting in isolation, but also about the interplay between brain networks supporting mutual influence between individuals in social networks (e.g., processes facilitating the spread of ideas or behaviors), as depicted by lines connecting brain regions across different people’s brains in the middle panel. In addition, it is possible to model how an individual’s social network resources or placement within their social network relate to their brain or behavior as depicted in the bottom panel. Adapted from Schmaezle et al. (2017).
