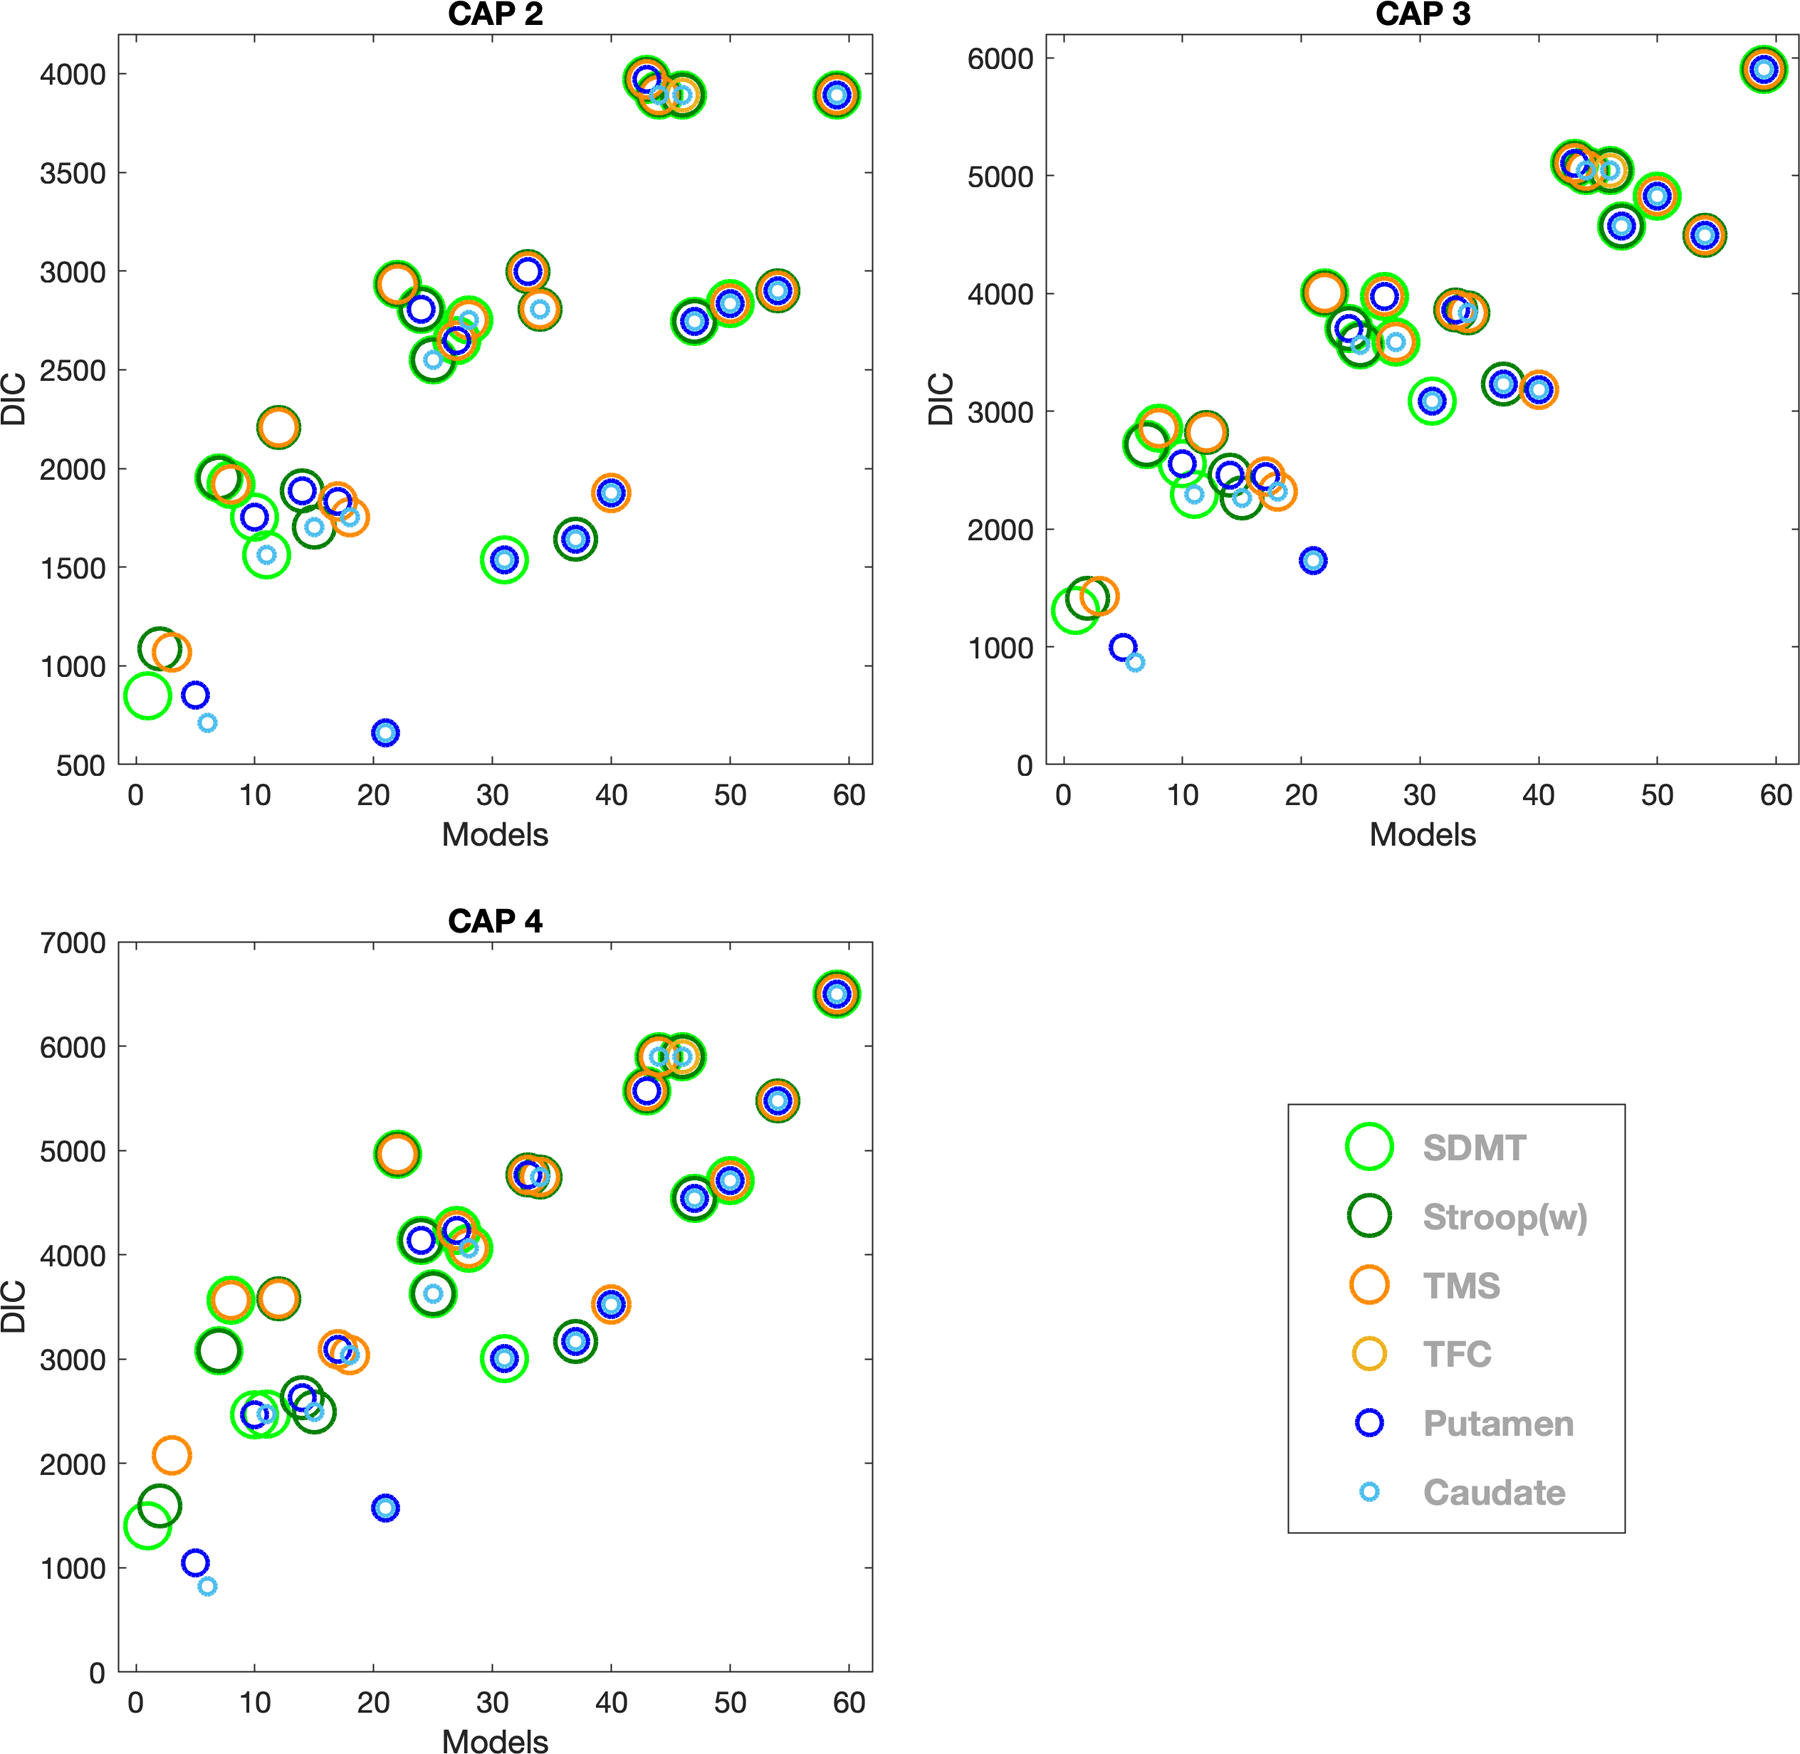
Figure 3:

DIC is plotted for CAP groups 2, 3 and 4 for all models based on the MLMM analysis (refer to Appendix 4 for the list of models) using the combined dataset. Circles of different colors represent six markers as follow (in order of decreasing radius): Light green: SDMT (Symbol Digit Modality Test), Green: Stroop (w), Dark orange: UHDRS-TMS (Unified Huntington’s Disease Rating Scale-Total Motor Score), Yellow: UHDRS-TFC (Unified Huntington’s Disease Rating Scale-Total Functional Capacity), Blue: Putamen volume and Light Blue: Caudate volume. Two (or more) circles of different colors and sizes at a single point represents a MLMM with two (or more) variables with respective colors of the circles. CAP 1 is not shown as all participants in this group are healthy controls and the purpose of this analysis is to find the model that best fits the disease progression.
