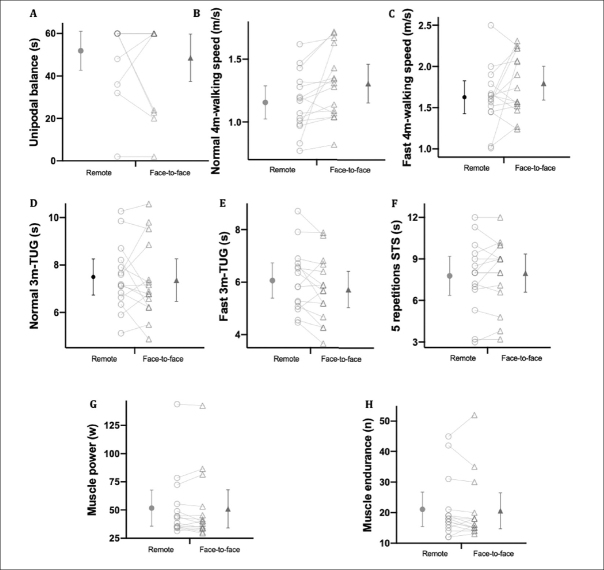
Figure 1.
Individual data in face-to-face and remote condition on functional capacities and muscle function
Individual data (n=15) for remote condition are presented as empty circle (○) and mean (±95% CI) as black circle (●) and for face-to-face condition as empty triangle (△) and mean (±95%CI) as black triangle (▲). (A) unipodal balance (s) individual data in face-to-face group (Mean: 48.6 ± 20.2; Min-Max: 2.00 – 60.00) and in remote group (Mean: 51.9 ± 16.6; Min-Max: 2.00 – 60.00); (B) normal 4m-walking speed (m/s) individual data in face-to-face group (Mean: 1.31 ± 0.28; Min-Max: 0.82 – 1.72) and in remote group (Mean: 1.16 ± 0.24; Min-Max: 0.77 – 1.62); (C) fast 4m-walking speed (m/s) individual data in face-to-face group (Mean: 1.80 ± 0.37; Min-Max: 1.24 – 2.31) and in remote group (Mean: 1.63 ± 0.36; Min-Max: 1.01 – 2.50); (D) normal 3m-Timed Up and Go (s; TUG) individual data in face-to-face group (Mean: 7.36 ± 1.63; Min-Max: 4.87 – 10.57) and in remote group (Mean: 7.49 ± 1.37; Min-Max: 5.11 – 10.26); (E) fast 3m-Timed Up and Go (s; TUG) individual data in face-to-face group (Mean: 5.73 ± 1.24; Min-Max: 3.66 – 7.88) and in remote group (Mean: 6.73 ± 1.21; Min-Max: 4.47 – 8.70); (F) 5-repetitions sit-to-stand (s; STS) individual data in face-to-face group (Mean: 7.97 ± 2.49; Min-Max: 3.15 – 12.00) and in remote group (Mean: 7.78 ± 2.56; Min-Max: 2.98 – 12.00); (G) muscle power (W; estimated using the Takaï equation (17)) individual data in face-to-face group (Mean: 51.0 ± 30.6; Min-Max: 29.4 – 142.5) and in remote group (Mean: 51.7 ± 29.1; Min-Max: 31.4 – 143.8); (H) muscle endurance (s; 30sec STS test (18)) individual data in face-to-face group (Mean: 20.6 ± 10.6; Min-Max: 13.0 – 52.0) and in remote group (Mean: 21.1 ± 10.2; Min-Max: 12.0 – 45.0).

