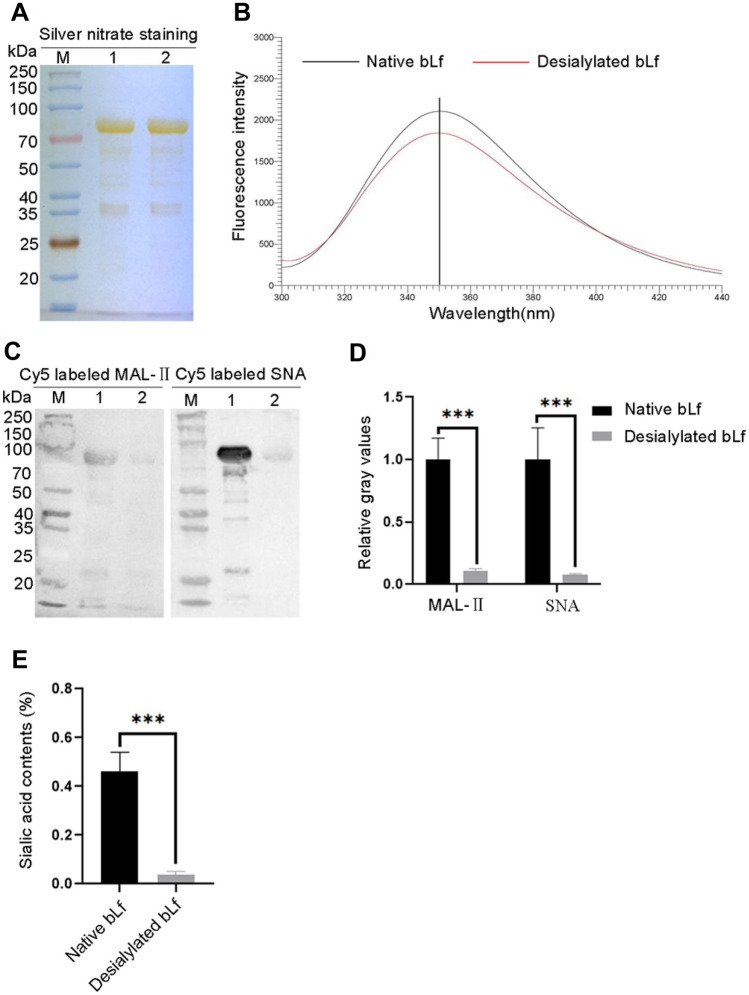
Fig. 1.
Verification of sialylated glycans on native or desialylated bLf. A Silver nitrate staining. B Fluorescence spectra. C Lectin blotting. Proteins were visualized by Cy5 labeled MAL-II (left) and Cy5 labeled SNA (right). D Gray value analysis. Relative gray values of lectin blotting were analysis from three replications by ImageJ software. E Quantification of sialic acid contents. Sialic acid contents of native or desialylated bLf were quantified and presented as a percentage of protein. M: protein molecular weight markers, lane 1: native bLf, lane 2: desialylated bLf. *P < 0.05, **P < 0.01, ***P < 0.001

