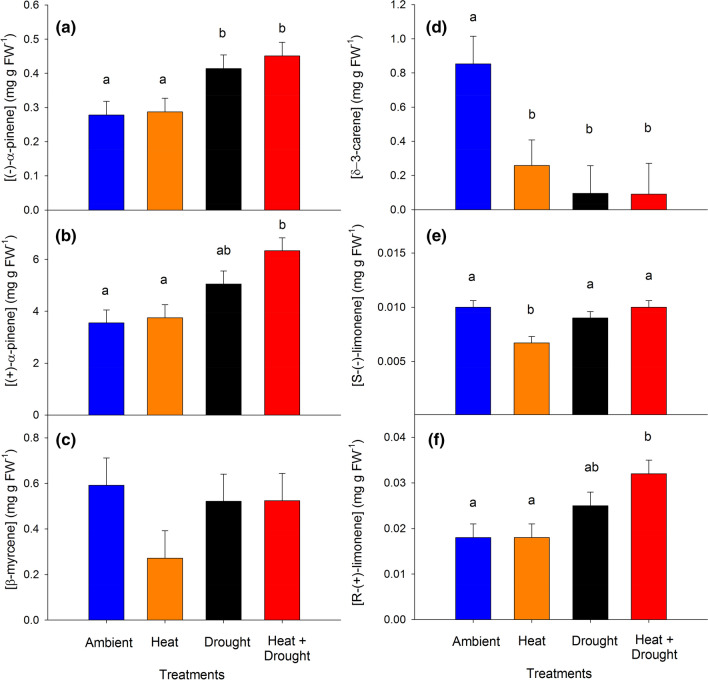
Fig. 8.
Monoterpene concentrations (mg g−1 FW) of six compounds in Pinus edulis woody tissue across the four treatments averaged over nine sampling periods (2012–2016). a (−)-α-Pinene, b (+)-α -pinene, c β -myrcene, d δ-3-carene, e S-(−)-limonene, f R-(+)-limonene. Compounds were chosen to highlight the variation in responses across treatments and tissues. Bars are means ± SEM and significance between treatments is expressed using different lowercase letters (α < 0.05)

