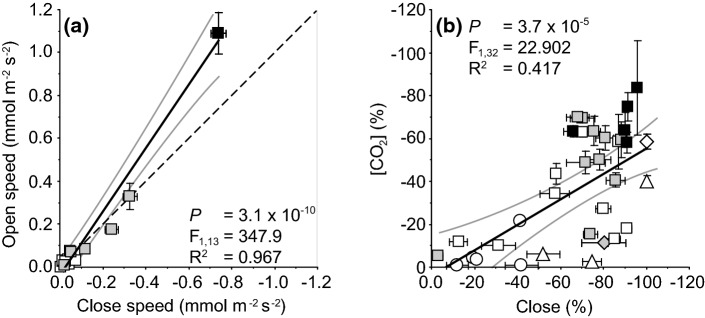
Fig. 3.
a The relationship between the rate of Gs increase (i.e. speed of stomatal opening) during a dark to light transition and the rate of Gs decrease (i.e. speed of stomatal closure) during a light to dark transition (see Fig. 4a and c for an example of stomatal kinetic responses). b Relationship between the percentage reduction in Gs during a step change in [CO2] from 400 to 2000 μmol mol−1 and the percentage reduction in Gs as stomatal close during a light to dark transition. Statistical analysis using linear regression. Data presented as in Fig. 1

