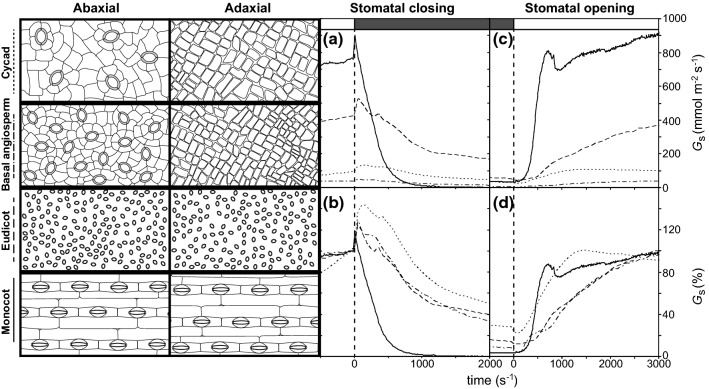
Fig. 4.
Example stomatal morphologies and distributions alongside stomatal closing (a, b) and opening (c, d) kinetics expressed as absolute and relative values for a cycad (Cycas sinanensis), a basal angiosperm (Magnolia grandiflora), a eudicot angiosperm (Chenopodium quinoa) and a monocot (Arundo donax). The key for identification of species is given on the left-hand y-axis. The rate of change of stomatal conductance, Gs, during stomatal opening or closing (Gs50%) is determined from the initial 50% of the Gs response

