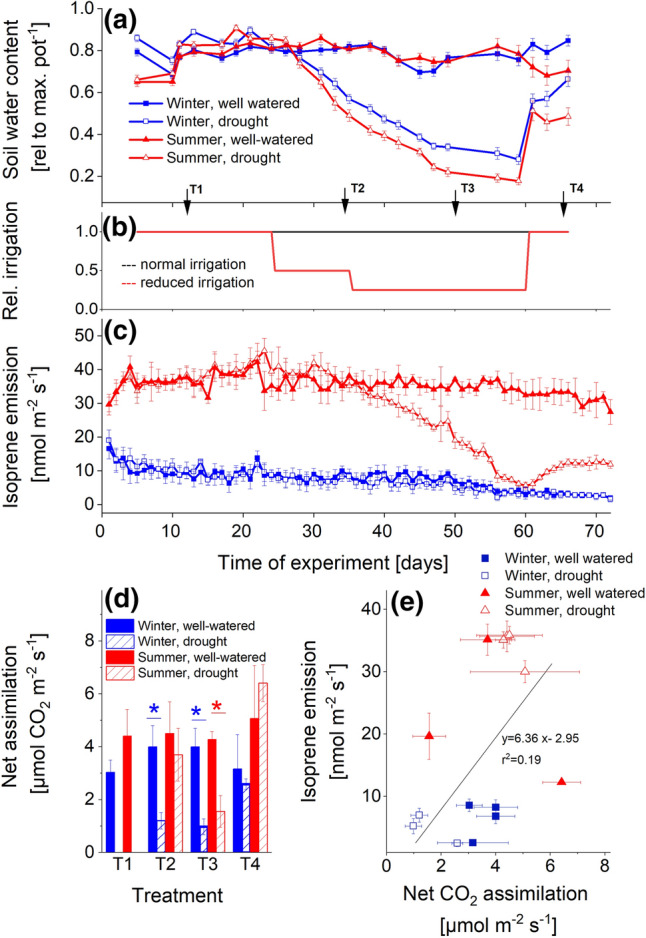
Fig. 1.

Effects of climate and drought on isoprene emission and net CO2 assimilation. a Relative soil water content of plant substrate; b relative irrigation level during the experiment; c isoprene emissions at midday (1 h mean at 12 noon); d net CO2 assimilation; e relationship between net assimilation and isoprene emission. T1–T4 indicates sampling times under pre-stress (T1), mild (T2), and severe (T3) water deprivations, and following re-watering (T4). Black arrows indicate the timepoints of leaf sampling for the proteomic analysis. Data shown are means ± SE (n = 4 replicates); *p < 0.05
