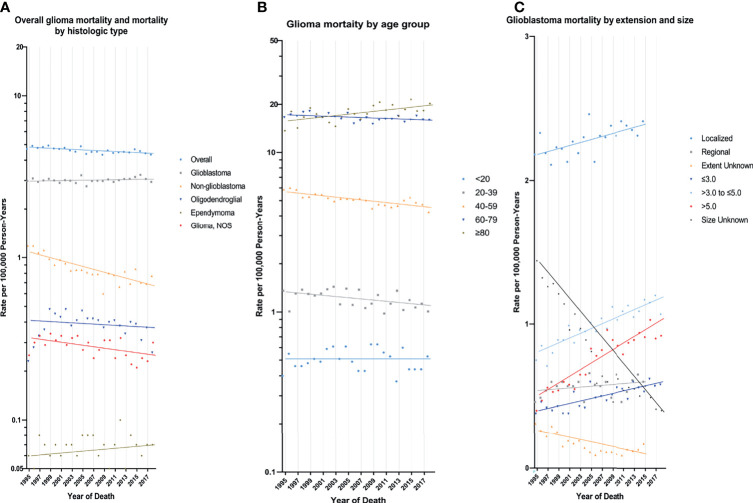
Figure 2.
Trends in Annual Glioma Mortality Rates. (A) represents glioma mortality (1995-2018), overall and by histologic type based on cases diagnosed during 1975-2018. (B) represents glioblastoma mortality (1995-2018) by age group based on cases diagnosed during 1975-2018. (C) represents glioblastoma incidence by tumor extension (1995-2015) and size (1995-2018) based on cases diagnosed during 1983-2015 and 1983-2018, respectively. Each point represents the observed incidence-based mortality rates (100,000 person-years). The slope of the lines represents the annual percent change (APC). All rates are age-adjusted to the 2000 US standard population.

