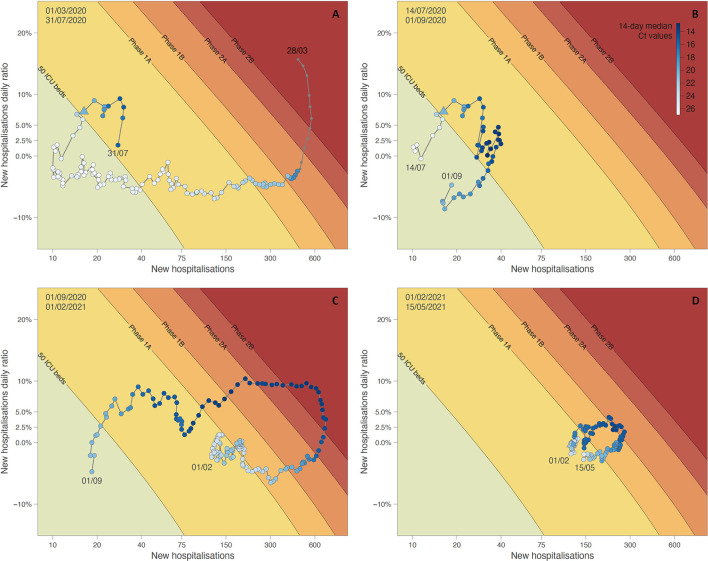
Figure 4.
Phase diagram generated for different time periods: situation from March 1 to July 14, 2020 (A), situation from July 14 to September 1, 2020 (B), and situation from September 1, 2020, to February 1, 2021 (C), situation from February 1 until May 15, 2021 (D). See the text for further detail on the principle of phase diagrams. Dots of the phase diagram are coloured according to 14-day median Ct values (thus computed using a backward sliding window of 14 days, from May 1, 2020). Triangle symbols indicate the dates when Ct values crossed down the threshold value of 22.3.

